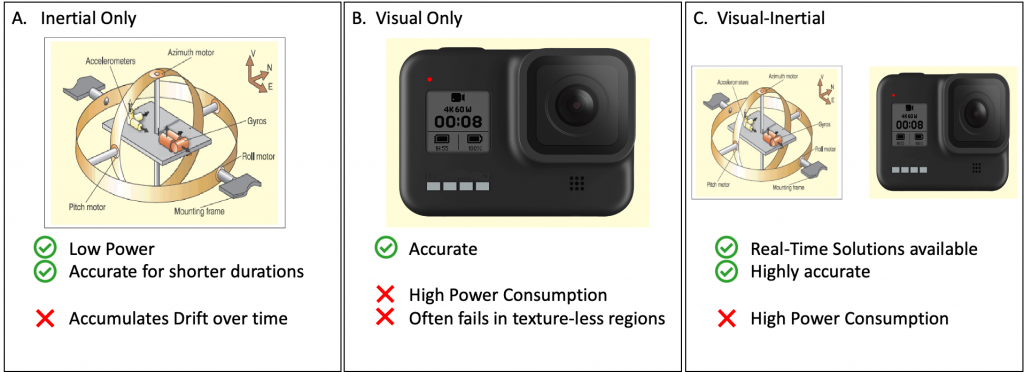
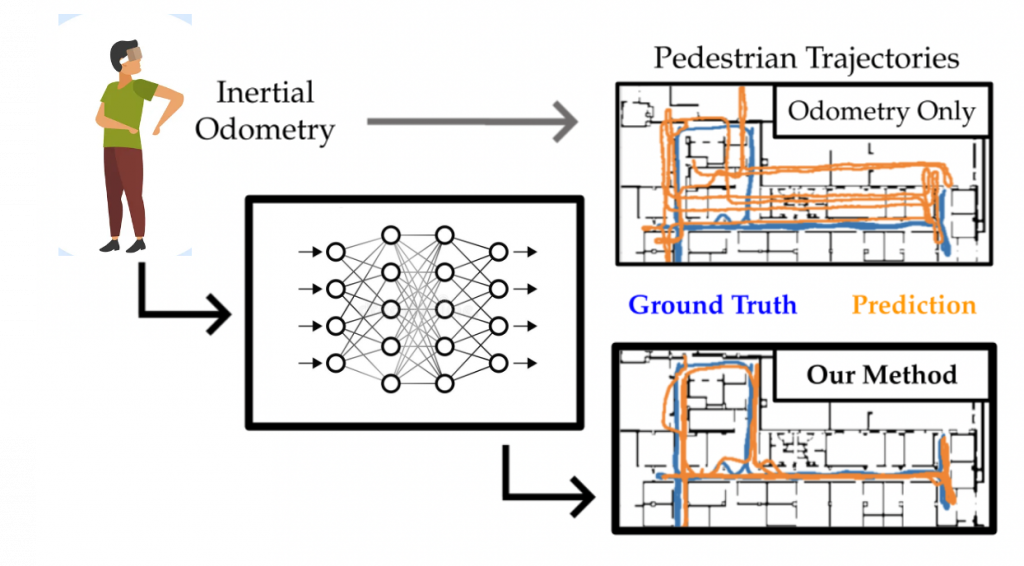
Fall ’23 progress

Visual odometry

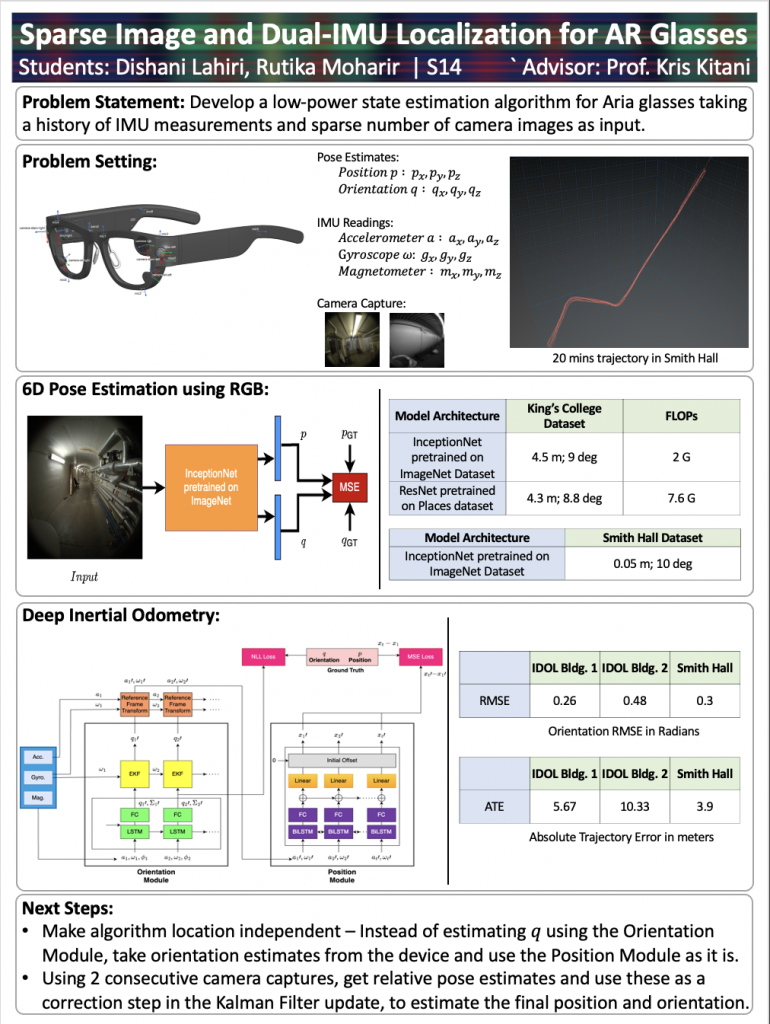
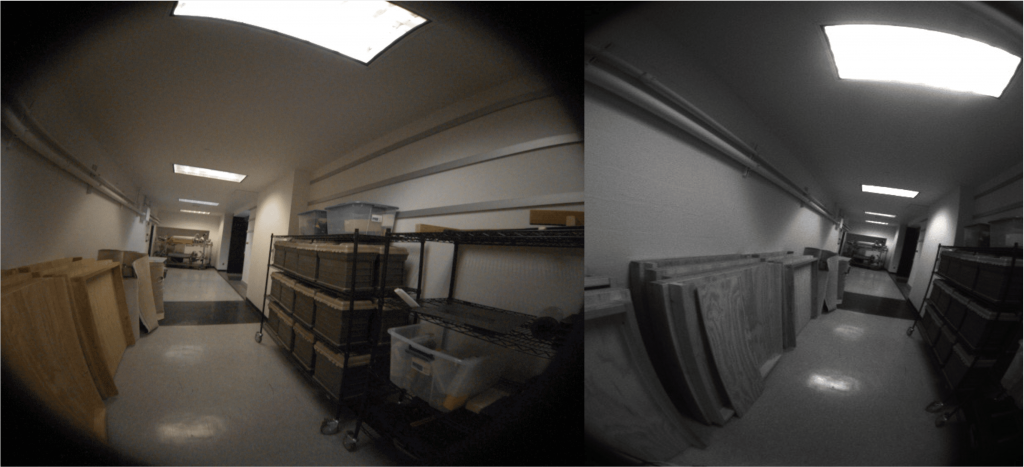
We remodel our visual odometry module such that it can be used in unseen environments as well. To this end, we take 2 RGB frames from different timesteps and find the relative pose of the glasses at the 2 timesteps.

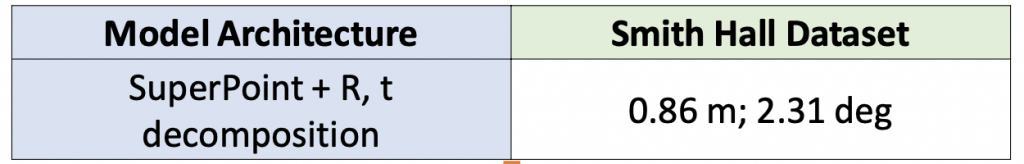
We utilize the general Structure from Motion pipeline for this purpose starting with finding robust matched correspondences. We use Superpoint (and SuperGlue) for finding reliable correspondences between the 2 image frames. Using these matched correspondences, we find the Essential matrix. The E matrix is now decomposed to find the relative rotation and translation between the 2 frames.

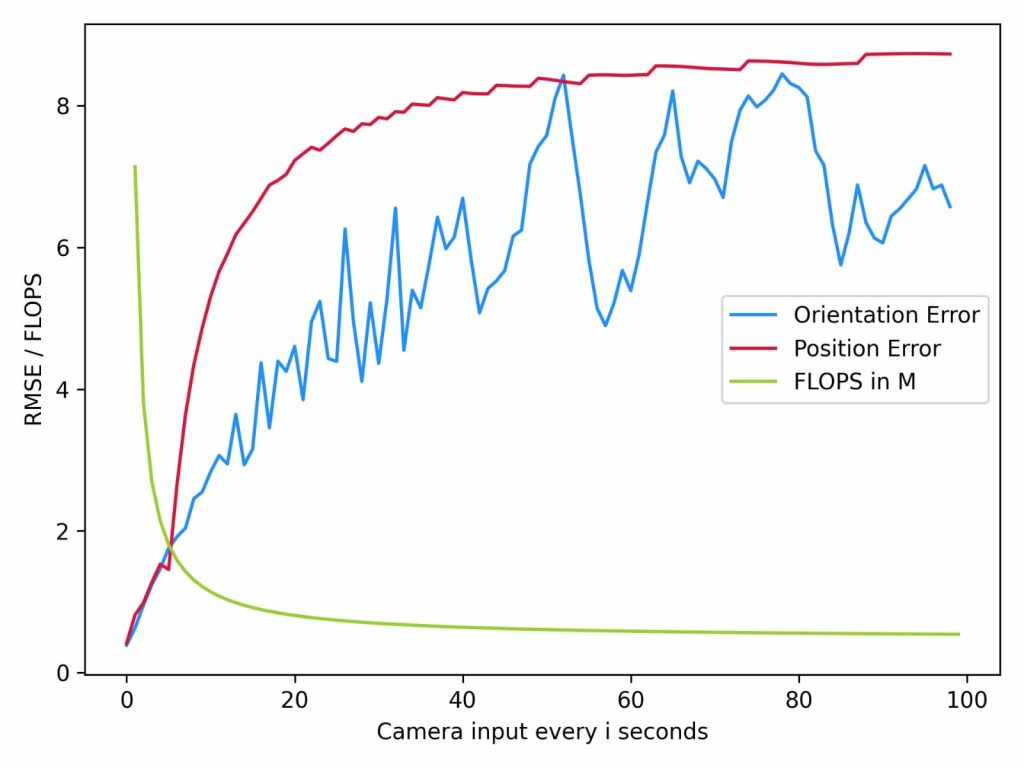
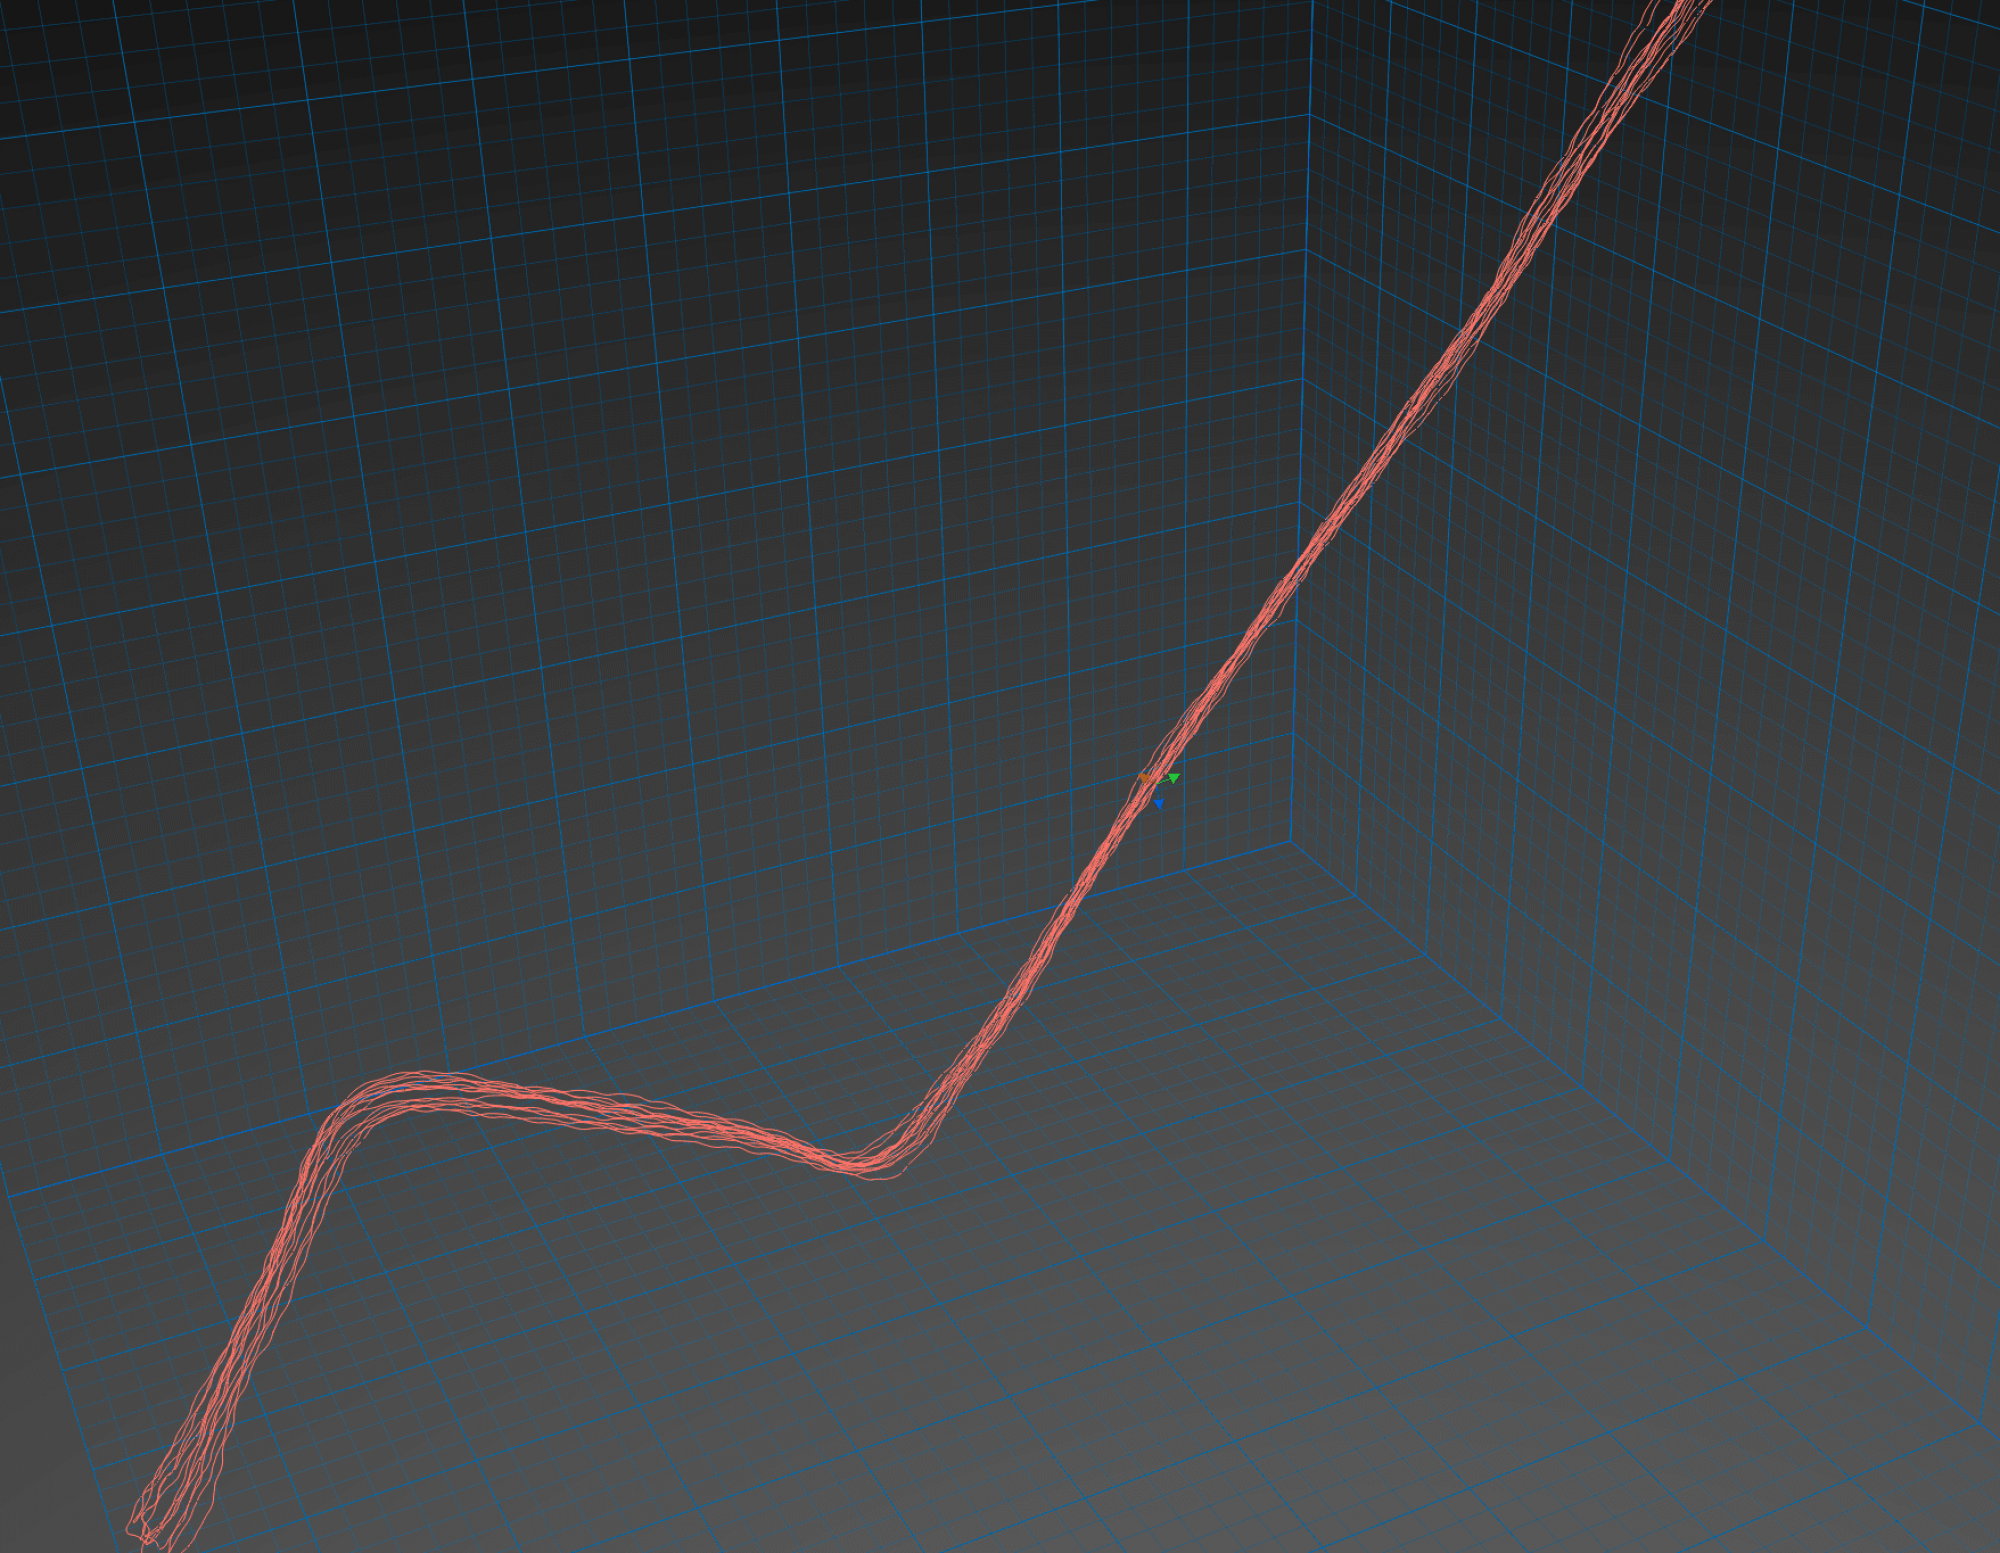
We observe that the error in rotation and translation increases with increasing the timestep gap between 2 frames.
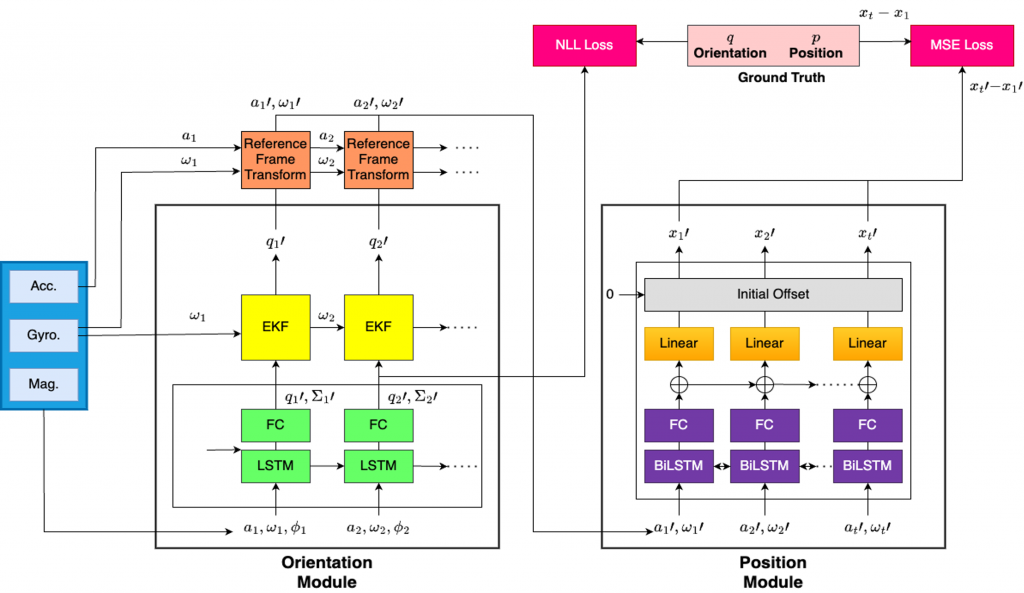
Inertial odometry

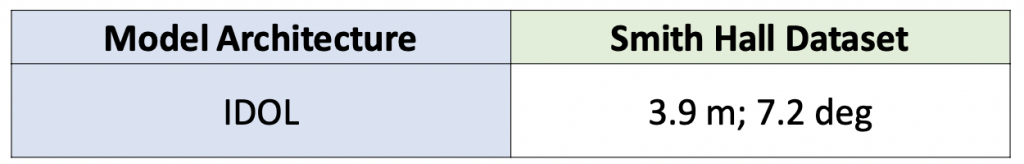
We use the IDOL model with extension to 6-D pose instead of 5-D pose to be used with the visual odometry predictions.

Classifier

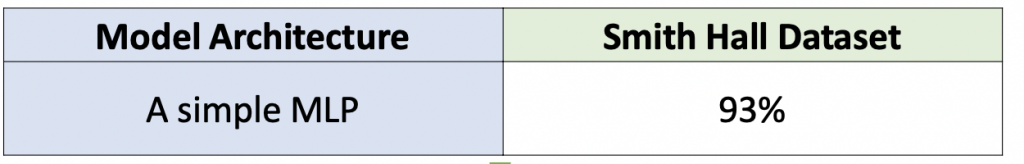
We aim to use the visual odometry module only when there is a major drift in the inertial odometry module. We use a classifier for this purpose. The classifier is trained on ground truth poses and the IDOL’s pose predictions using a hyperparameter threshold. The model architecture is a simple 3-layered MLP.

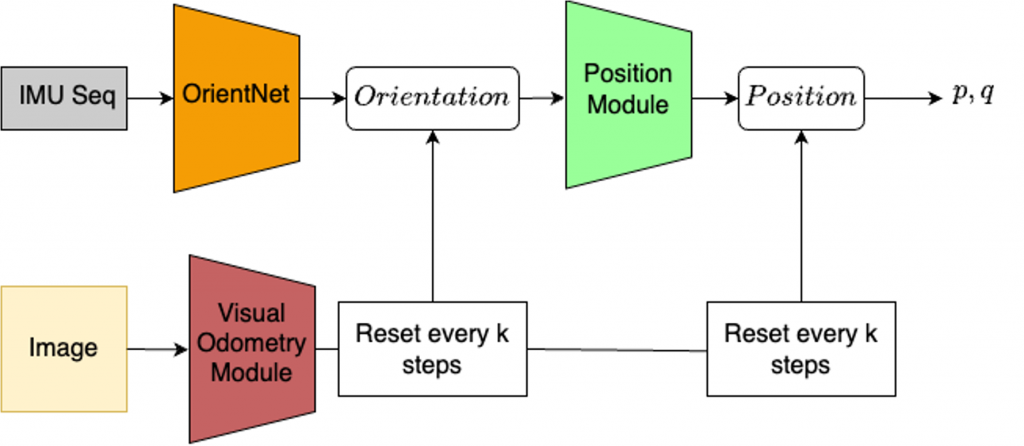
Visual-Inertial odometry

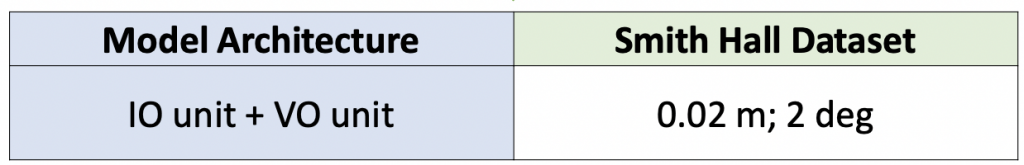
When we combine the VO and IO predictions in a weighted fashion and turn on the camera based on the classifier’s predictions, we are able to get accurate pose predictions with very low power consumption.

Spring ’23 results

Visual Odometry

The inceptionNet-based model produces similar results to the ResNet-based model with nearly half the number of FLOPs. Thus, we went ahead with InceptionNet architecture itself to train on the Smith Hall dataset collected using Aria glasses.

The metrics used here are RMSE (Root Mean Square Error) over position and orientation error in terms of the difference in degrees between predicted and ground truth. As we can see, the position and orientation error using Visual Odometry is pretty low.

The model has been tested on 2 completely different datasets. The King’s College dataset is an outdoor dataset with a variety of difficult scenarios like motion blur, a clutter of pedestrians, and varying lighting conditions. On the other hand, the Smith Hall dataset is an indoor dataset that has very few keypoint features in certain areas and dim lighting as well. Thus, the Visual only odometry module performs robustly.

Inertial Odometry

These are the results from our Inertial-only module which has been tested on 3 datasets to showcase robustness.

The metric used for measuring orientation error is the RMSE between the predicted quaternions and the ground truth quaternions.

For position error, we use Absolute Trajectory Error (ATE) which is the RMSE between corresponding points in the estimated and ground truth trajectories. This is a measure of global consistency and usually increases with trajectory length.

Combined Low-Power Visual-Inertial Odometry

Plot showing an increase of error and decrease of FLOPS by reducing the frequency of VO module utilization

In order to capitalize on the pros of each component, we aim to utilize the accurate Visual Odometry (VO) module at fixed intervals of time in order to reset the low-power Inertial Odometry (IO) module.

We are gradually reducing the frequency of using VO for pose prediction. At every ith second, we are using the VO prediction instead of the IO prediction and resetting the IO module using this prediction. Thus, we see that as we remove the dependency on VO, the position and orientation error keeps increasing as expected. These experiments have been performed on the Smith Hall dataset.

The plot also notes the Floating Point Operations Per Second (FLOPS) of our system. FLOPS is a reliable way of reporting how power-hungry and latency-causing a module is. Thus, we note that as we keep reducing the usage frequency of the VO module, the FLOPS also reduces. This is because the FLOPS for the VO module is 2 G and for the IO is 471 K. The VO module has higher latency than the IO module.

Thus, we conclude that using VO intermittently enables improved accuracy of the IO method.

Team

Students

Dishani Lahiri

Dishani is a graduate student pursuing a Master of Science in Computer Vision (MSCV) at CMU. She completed her undergraduate degree from Delhi Technological University, India. Prior to CMU, she worked as a Senior CV Engineer at Samsung Research & Development Institute, Bengaluru in the Visual Intelligence Group. At Samsung, she was one of the key developers of the Night Mode and Expert RAW applications currently deployed in flagship phones.

Rutika Moharir

Rutika is a first year Master of Science in Computer Vision student at RI, CMU and is advised by Prof. Kris Kitani. Her interests span in developing computer vision algorithms for various perception use cases. Prior to joining CMU, she worked as a Senior Machine Learning Engineer at Samsung Research where she worked on developing on-device solutions of Scene Text Recognition for multiple use cases of Samsung mobile devices.

Advisor

Kris Kitani

Kris M. Kitani is an associate research professor of the Robotics Institute at Carnegie Mellon University. He received his BS at the University of Southern California and his MS and PhD at the University of Tokyo. His research projects span the areas of computer vision, machine learning and human computer interaction. In particular, his research interests lie at the intersection of first-person vision, human activity modeling and inverse reinforcement learning. His work has been awarded the Marr Prize honorable mention at ICCV 2017, best paper honorable mention at CHI 2017 and CHI 2020, best paper at W4A 2017 and 2019, best application paper ACCV 2014 and best paper honorable mention ECCV 2012.

Project Responsibilities

Dishani and Rutika contributed equally to this project from inception under the mentorship of Prof. Kris Kitani.

OUR CONTRIBUTIONS

VISUAL ODOMETRY MODULE

We implement PoseNet with InceptionNet backbone with appropriate changes to the final fully-connected layers to regress the 7D pose i.e. 3D position (x, y, z) and 4D quaternion.

We train this model on the dataset collected in the basement of Smith Hall using Aria Glasses. For establishing our baseline, we have also tested our model on the King’s College Dataset in order to compare it against PoseNet[1] implementation.

Using the RGB camera ensures that the predicted pose is quite accurate with the only downside of a higher power consumption.

INERTIAL ODOMETRY MODULE

We use IDOL: Inertial Deep Orientation-Estimation and Localization[2] architecture as our baseline. We have trained this model on IDOL dataset and also on our dataset collected using Aria glasses.

This model aims to regress the pose using IMU readings.

These sensors can operate using very low power consumption but they accumulate drift quickly over time. Hence, they are accurate only for a short duration.

COMBINED LOW-POWER VISUAL-INERTIAL ODOMETRY MODULE

Architecture combining the VO and IO modules

In order to find a balance between the pros and cons of the visual odometry system and the inertial odometry system, we combine the inertial odometry model with the visual odometry model. We use the visual odometry prediction after every kth timestep such that we can reset the inertial odometry system which has collected drift till this timestep.

We try to find the best possible ‘k’ value which strikes the balance between power consumption i.e. frequency of RGB frames used v/s the accuracy of the overall predictions.

OVERVIEW OF THE ABOVE METHODS

REFERENCES

[1] Kendall, Alex, et al. “PoseNet: A Convolutional Network for Real-Time 6-DOF Camera Relocalization”, IEEE International Conference on Computer Vision (ICCV), 2015

[2] Sun, Scott, et al. “IDOL: Inertial Deep Orientation-Estimation and Localization“, AAAI Conference on Artificial Intelligence, 2021

TASK FORMULATION

BACKGROUND INFORMATION

What is localization/state estimation?

Given a dynamic agent in an environment, one would want to estimate the location and orientation (i.e. pose) of the agent relative to an arbitrary global reference frame.

What is the exact meaning of pose?

Pose information can be represented as a pose vector p which is a combination of a 3D position x and orientation represented by a quaternion q giving us: p=[x, q] 

Why is it needed?

Accurate pose estimation is needed for a wide range of applications including navigation, virtual reality, and augmented reality.

DATASETS

For the Visual odometry baseline, we used the King’s College Dataset which is a subset of the Cambridge Landmarks dataset. The dataset maps an RGB image with its ground truth pose i.e. 3D position and 4D orientation. The dataset is diverse in terms of motion blur, clutter of vehicles and people, and varying lighting conditions.

For the Inertial odometry baseline, we used the dataset created by the authors of Inertial Deep Orientation-Estimation and Localization (IDOL). The dataset maps IMU readings from the accelerometer, gyroscope and magnetometer sensors with the relative pose estimates.

Data collection rig used for IDOL dataset

SETUP FOR ARIA DATASET

Aria Glasses and components
Image captured by Aria Glasses. Left: RGB camera capture, right: Grayscale camera capture

For our use case, we collect sample trajectories using the Aria glasses. The Aria glasses have built-in IMU sensors and RGB cameras and thus are a great setup for our use case.

To obtain the ground-truth pose estimates for our Visual-Inertial Odometry system we make use of the Aria Research Kit. Using this toolkit Project Aria’s Academic Research Partners can request Machine perception Services for the trajectory data and obtain 6-DOF pose estimates.

We use the toolkit developed by Meta in order to obtain the ground-truth pose estimates. The following image is a screenshot from the toolkit which shows the trajectory recorded in Smith Hall.

INTRODUCTION

PROBLEM STATEMENT

Our task is to develop a low-power state estimation algorithm for Aria glasses using a history of Inertial Measurement Unit (IMU) measurements combined with a sparse number of RGB images as input.

IMUs SUMMARY

The IMU is a combination of the accelerometer, gyroscope, and magnetometer sensors. The accelerometer sensor measures the linear acceleration while the gyroscope measures the angular velocity. The magnetometer measures the magnetic flux density, which is just a combination of magnetic field strength and direction.

Each of the 3 sensors takes measurements in the 3 axes relative to the device.

OUR HYPOTHESIS

Fusing the camera’s relative pose with the inertial sensor measurements can increase the accuracy and robustness of the state estimates when compared with inertial-only methods such as IDOL with just a small increase in power consumption.