Visual Odometry
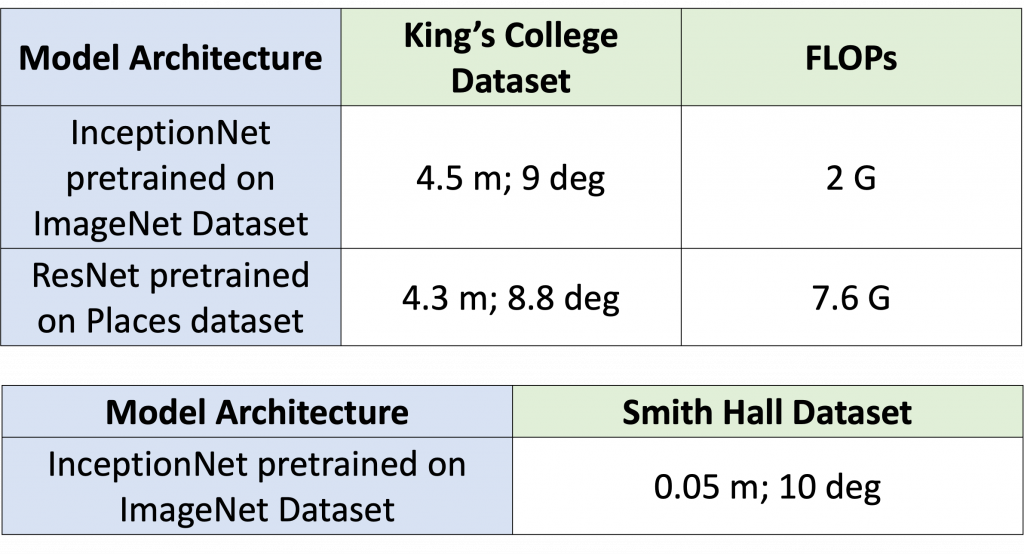
The inceptionNet-based model produces similar results to the ResNet-based model with nearly half the number of FLOPs. Thus, we went ahead with InceptionNet architecture itself to train on the Smith Hall dataset collected using Aria glasses.
The metrics used here are RMSE (Root Mean Square Error) over position and orientation error in terms of the difference in degrees between predicted and ground truth. As we can see, the position and orientation error using Visual Odometry is pretty low.
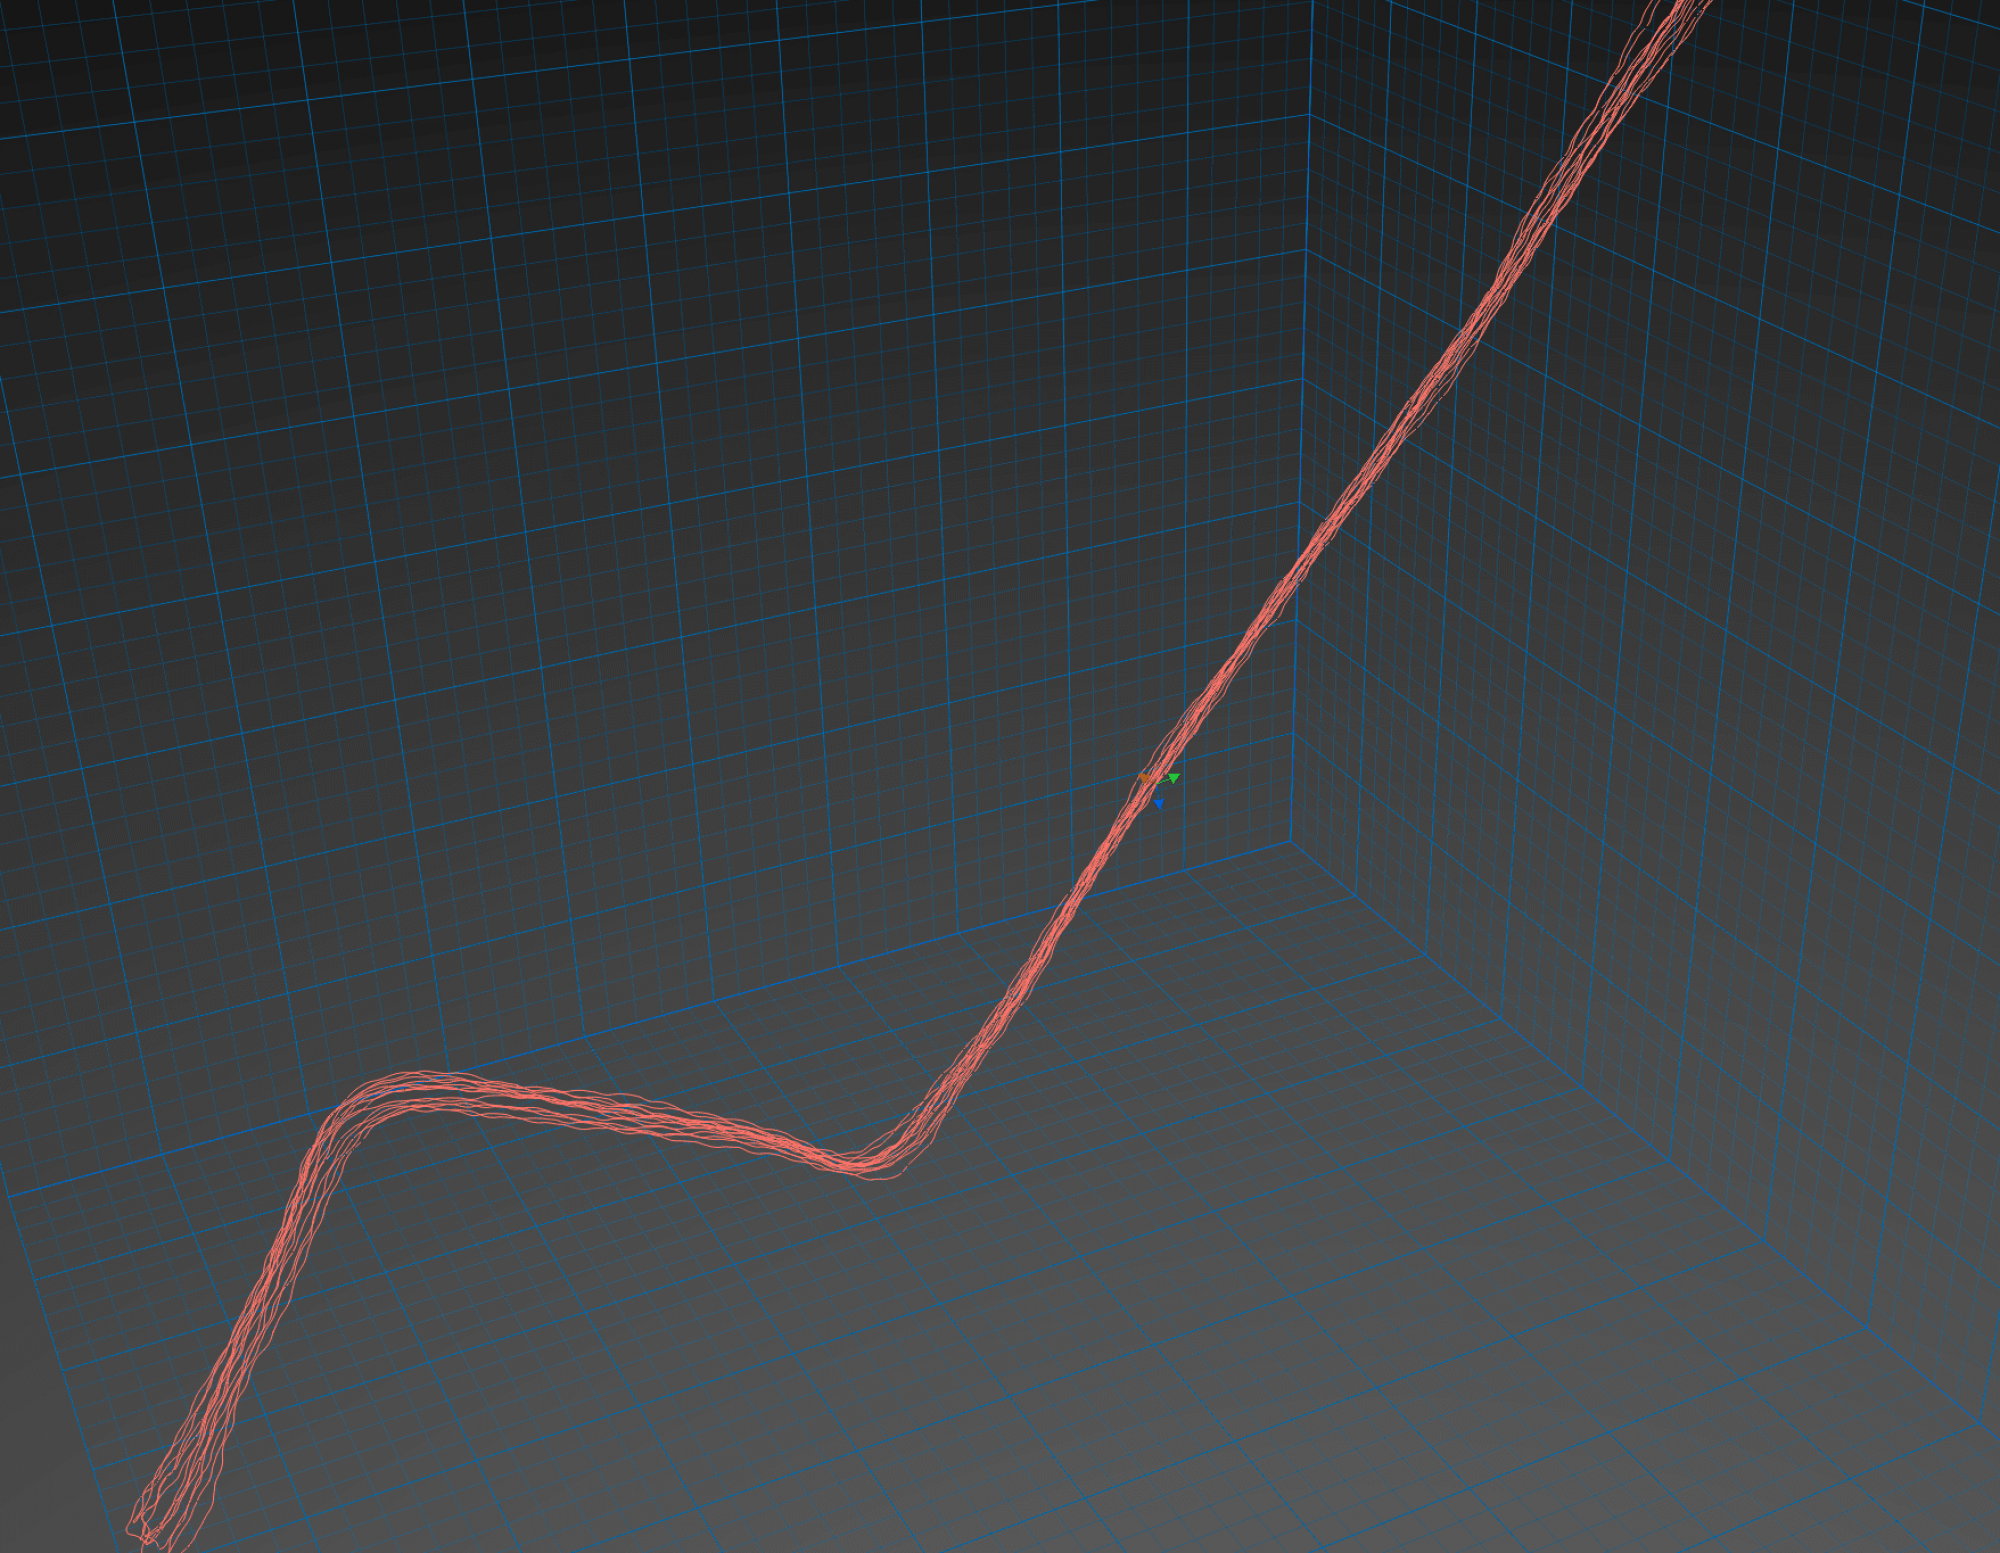
The model has been tested on 2 completely different datasets. The King’s College dataset is an outdoor dataset with a variety of difficult scenarios like motion blur, a clutter of pedestrians, and varying lighting conditions. On the other hand, the Smith Hall dataset is an indoor dataset that has very few keypoint features in certain areas and dim lighting as well. Thus, the Visual only odometry module performs robustly.
Inertial Odometry
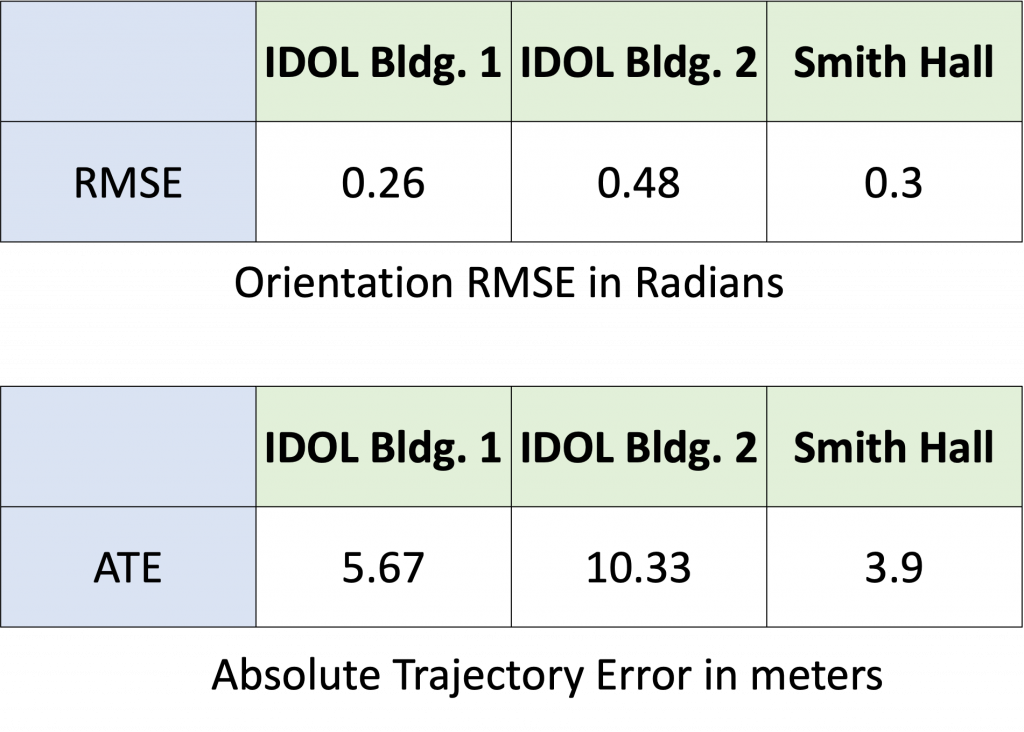
These are the results from our Inertial-only module which has been tested on 3 datasets to showcase robustness.
The metric used for measuring orientation error is the RMSE between the predicted quaternions and the ground truth quaternions.
For position error, we use Absolute Trajectory Error (ATE) which is the RMSE between corresponding points in the estimated and ground truth trajectories. This is a measure of global consistency and usually increases with trajectory length.
Combined Low-Power Visual-Inertial Odometry
In order to capitalize on the pros of each component, we aim to utilize the accurate Visual Odometry (VO) module at fixed intervals of time in order to reset the low-power Inertial Odometry (IO) module.
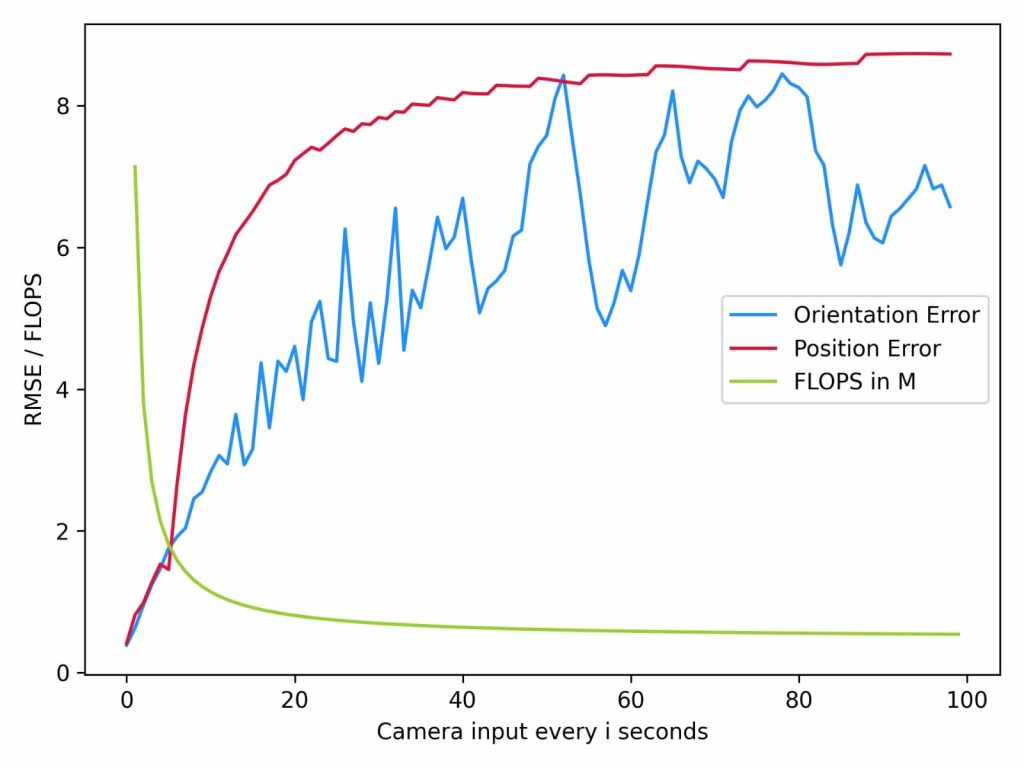
We are gradually reducing the frequency of using VO for pose prediction. At every ith second, we are using the VO prediction instead of the IO prediction and resetting the IO module using this prediction. Thus, we see that as we remove the dependency on VO, the position and orientation error keeps increasing as expected. These experiments have been performed on the Smith Hall dataset.
The plot also notes the Floating Point Operations Per Second (FLOPS) of our system. FLOPS is a reliable way of reporting how power-hungry and latency-causing a module is. Thus, we note that as we keep reducing the usage frequency of the VO module, the FLOPS also reduces. This is because the FLOPS for the VO module is 2 G and for the IO is 471 K. The VO module has higher latency than the IO module.
Thus, we conclude that using VO intermittently enables improved accuracy of the IO method.