
Approach 1: Detection Model trained on COCO, LVIS, NuScenes, ArgoVerse 2.0
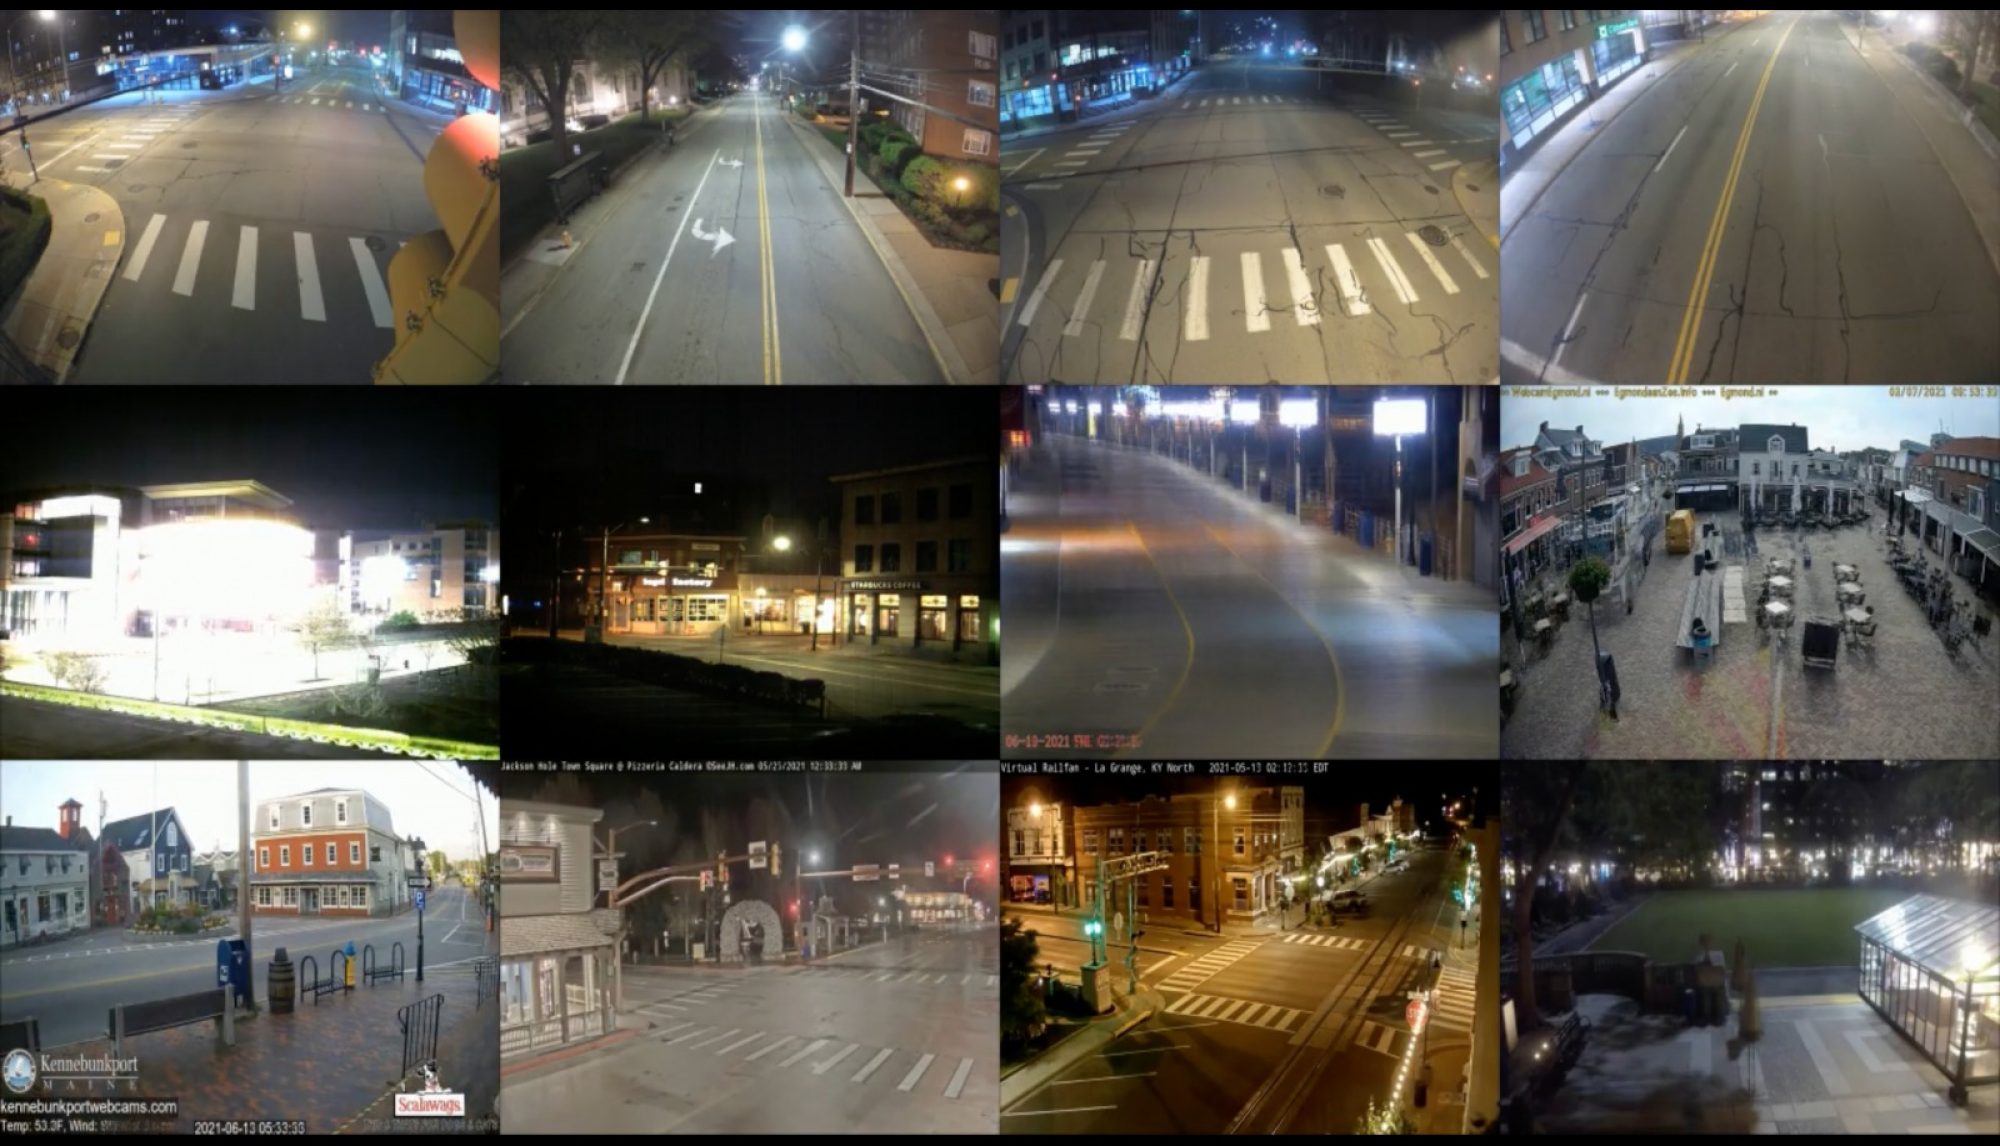
The results for the experiments run during the early stages of the project owing to approach 1 as explained in the previous section is discussed here. We ran the LVIS + NuScenes + COCO model on the 100 live cameras and collected data for a month and performed the following analysis.
- We first got an understanding of the counts of the selected LVIS classes detected across the active cameras for a given time frame. The X-axis indicates the camera IDs and Y-axis indicates the counts and the colors indicate the LVIS class type.
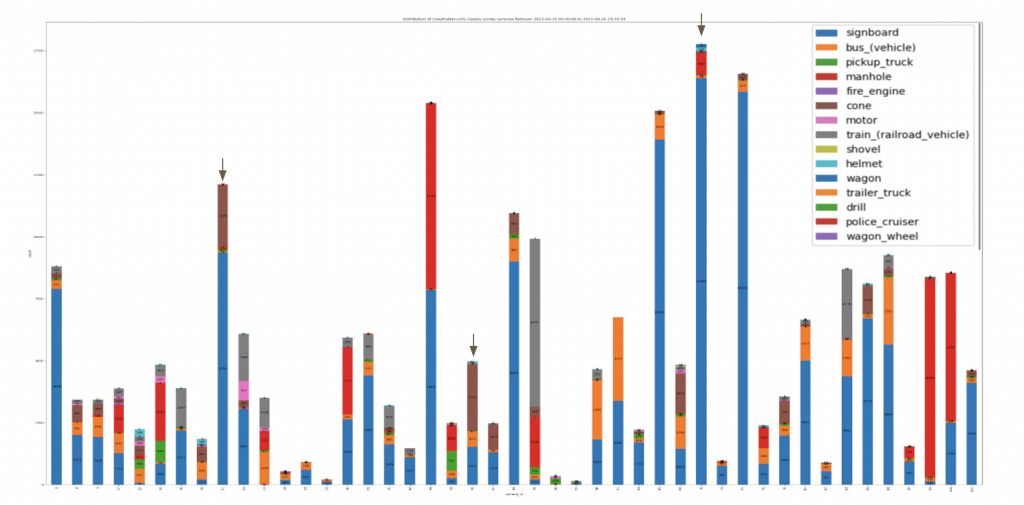
We see that a class like sign board is detected in every other camera and hence though a necessary condition, not a sufficient condition for presence of work zone scene. Hence we consider top – n cameras with highest counts for the cone (“brown” in the above plot) class and perform further analysis in them.
2. Now we further try to analyze the count distribution of each of these classes in the camera selected in the previous step.
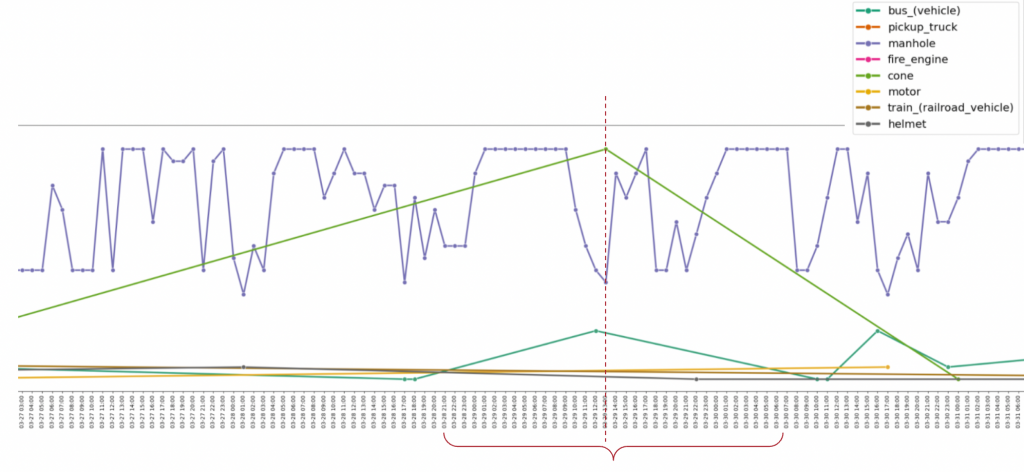
As we can see from the plot, there is a high probability of finding a frame containing a work zone scene at and around the time stamp marked in red.
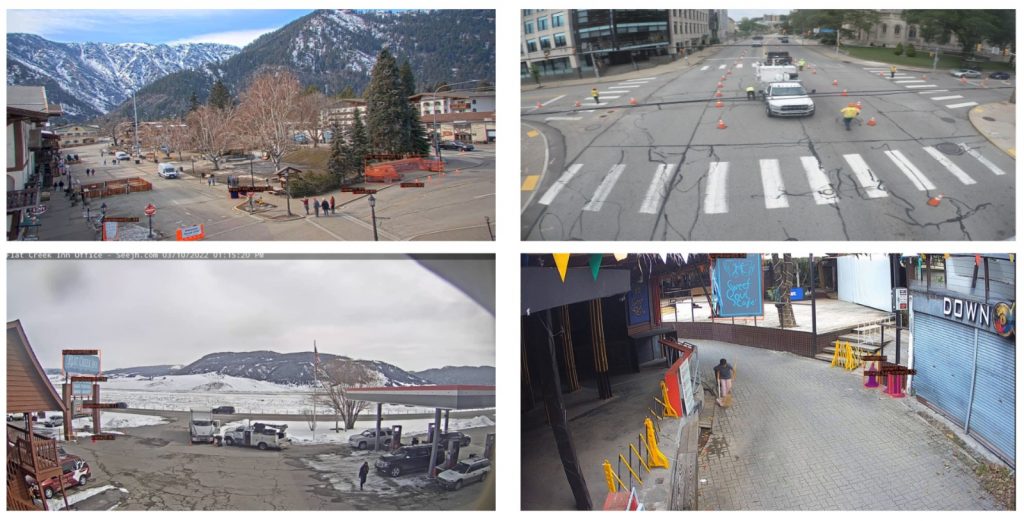
3. With the results from the analysis performed in the previous steps, we sample the corresponding frames from the camera footages and the results are as follows:
Approach 2: Instance Segmentation Model trained on ILIM Dataset
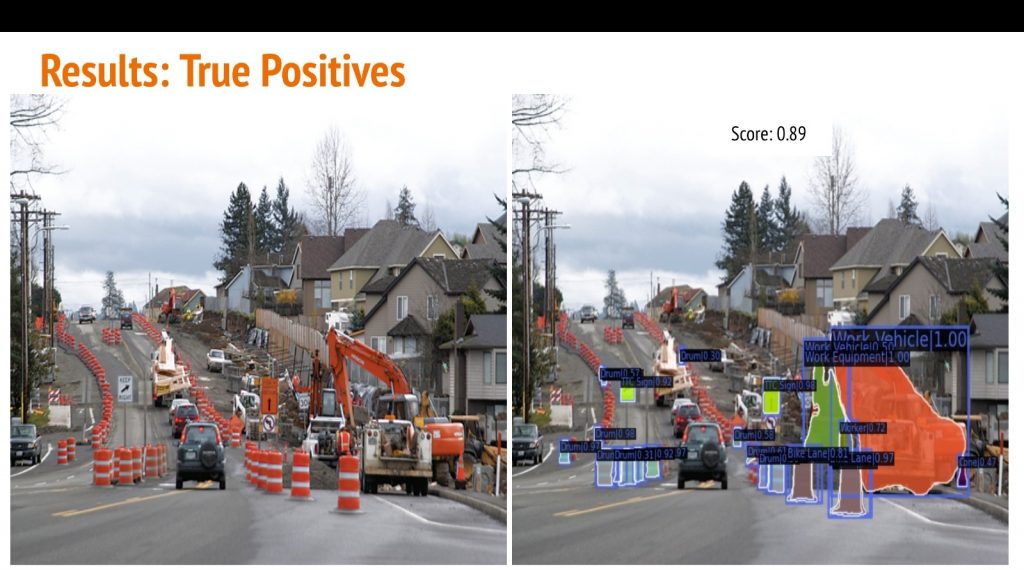
Results corresponding to the approach 2 discussed in the previous page are shown here. A Mask-RCNN model was fine-tuned on the annotated dataset and analyzed for results. The model performed at an mAP of 0.324 with IOU threshold of 0.5. While the metrics of the trained model did establish a baseline performance for the task of construction zone detection, it was not satisfactory.

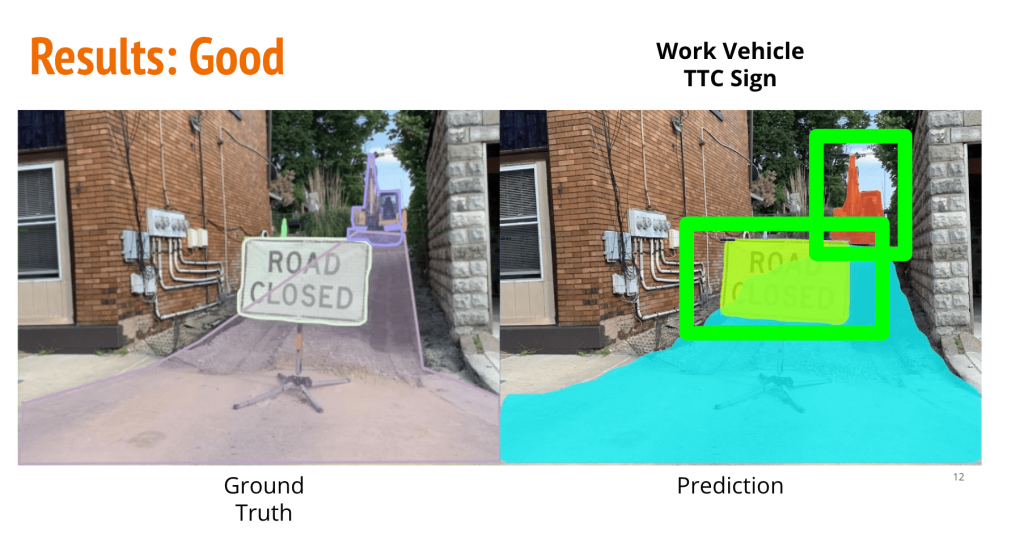
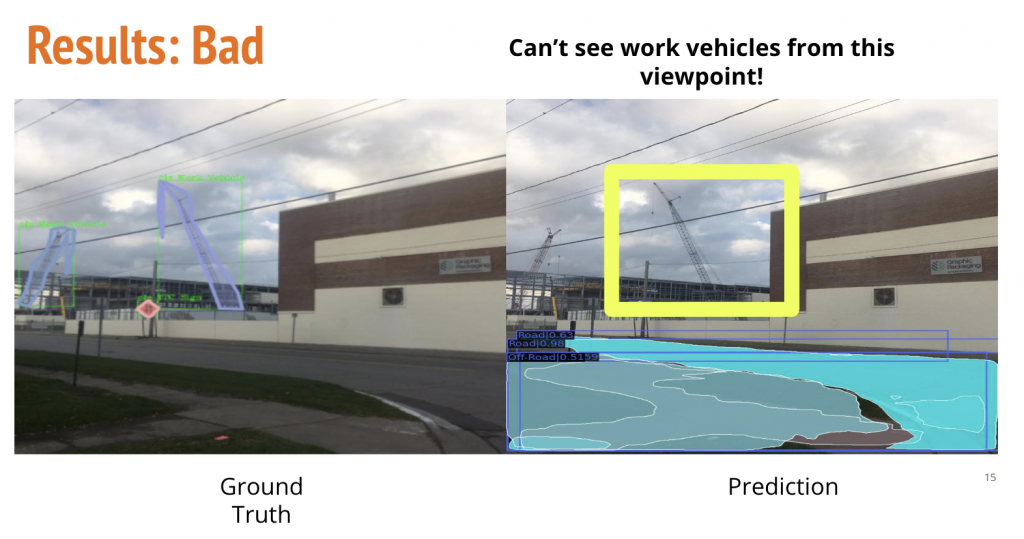
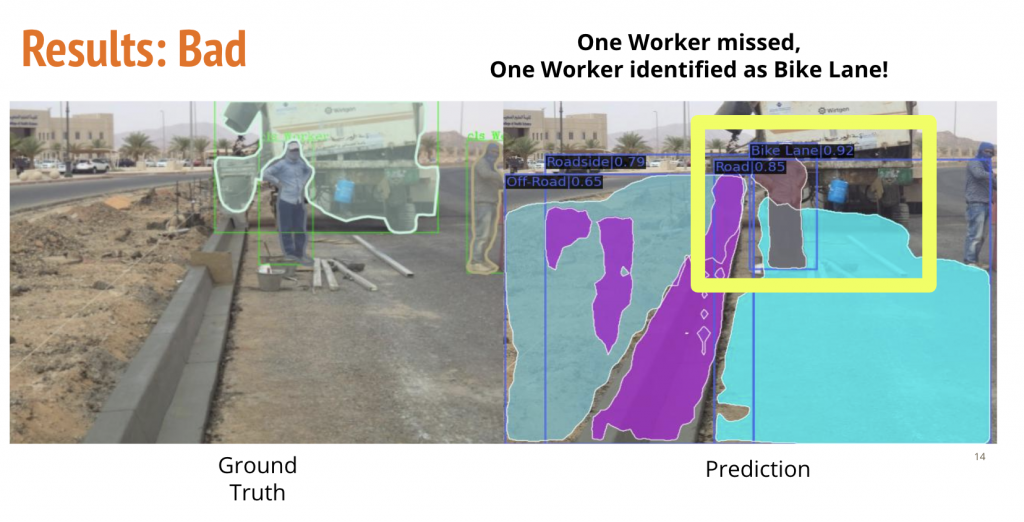
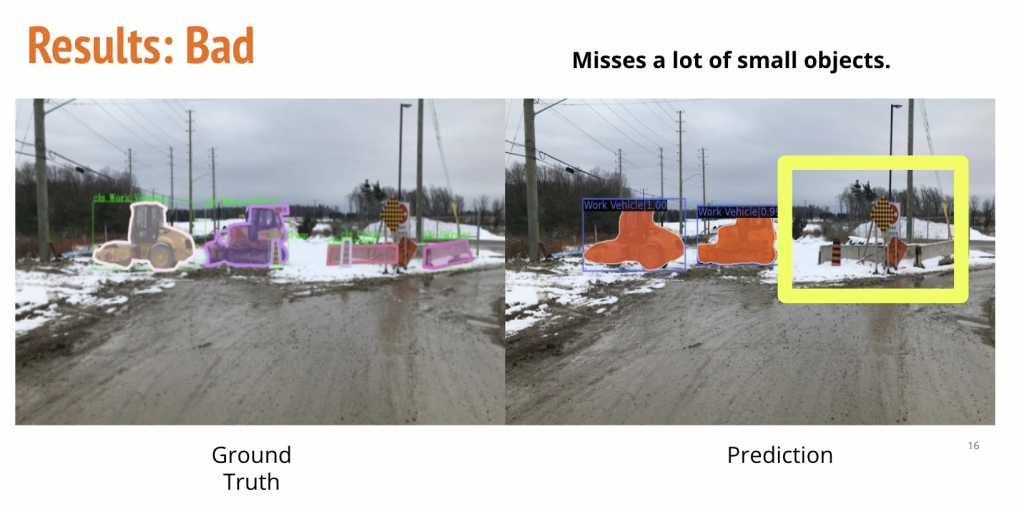
Qualitative Results
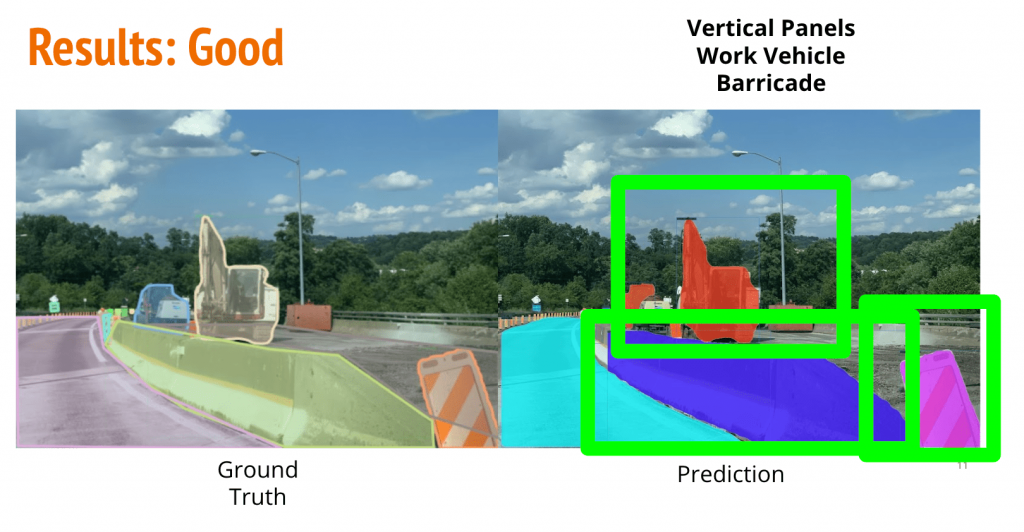
Takeaways
- There are incorrect annotations in the annotated dataset. This is expected due to the intense manual effort and is essentially human error.
- The model finds it difficult to generalise to intra-class variations in categories such as work-vehicle owing to limited dataset for a large variety.
- The model does not perform very well on small objects. This is also representative of the fact that manual annotations are limited beyond a size range. It is hard for humans to annotate very small objects and this is what propels the augmentation strategies for smaller datasets.
The model is further enhanced with two augmentation strategies as described.
Approach 3: Instance Segmentation Model trained on Original + Augmented Data
Results achieved on using augmented data as part of the training data for our models as explained in approach 3 are discussed here.
2D cut-and-paste augmentation
Cones, drums, vertical panels and TTC message boards were the 4 augmented categories using 2D clip and paste augmentations. Here is a sample data point, before and after 2D cut-and-paste augmentation.
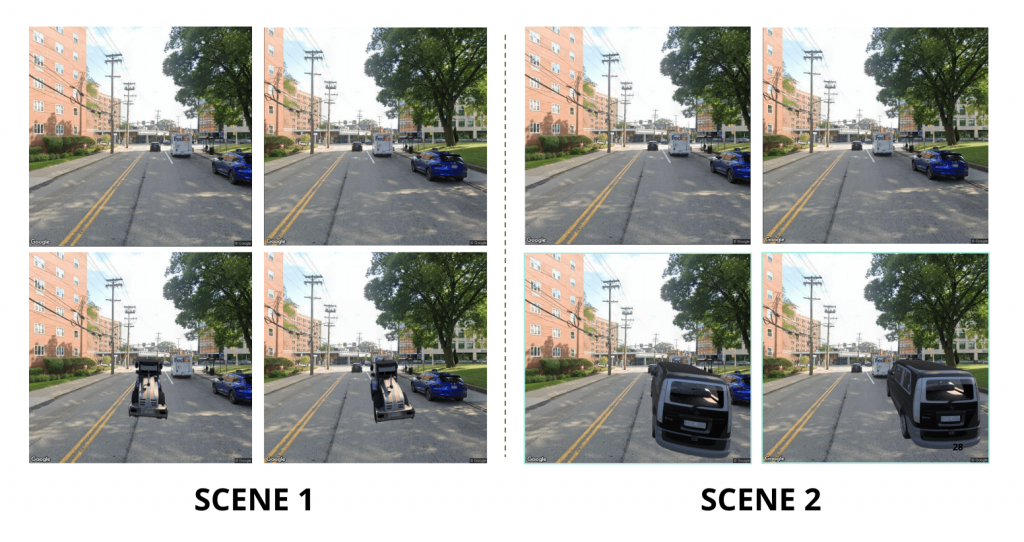
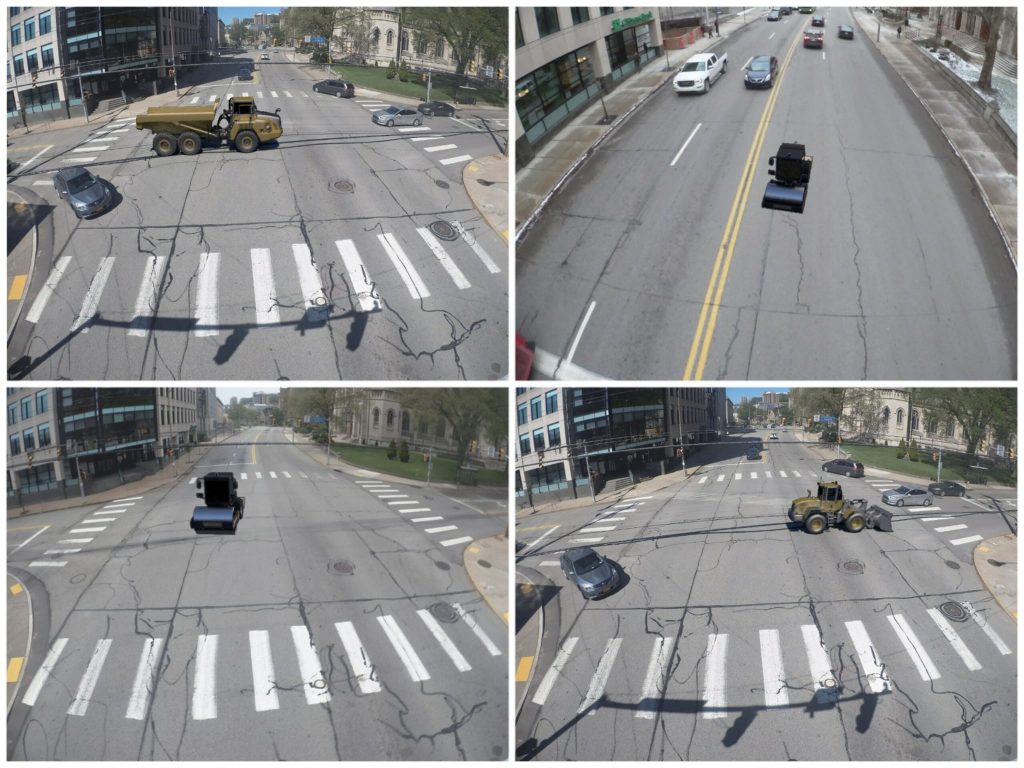
Mixed-Reality based 3D Synthetic Data Augmentations
Here are a few samples of augmented data generated using the approach 3 stated in the experiments section. The number of data points created this way are limited by the number of work-zone relevant 3D assets.
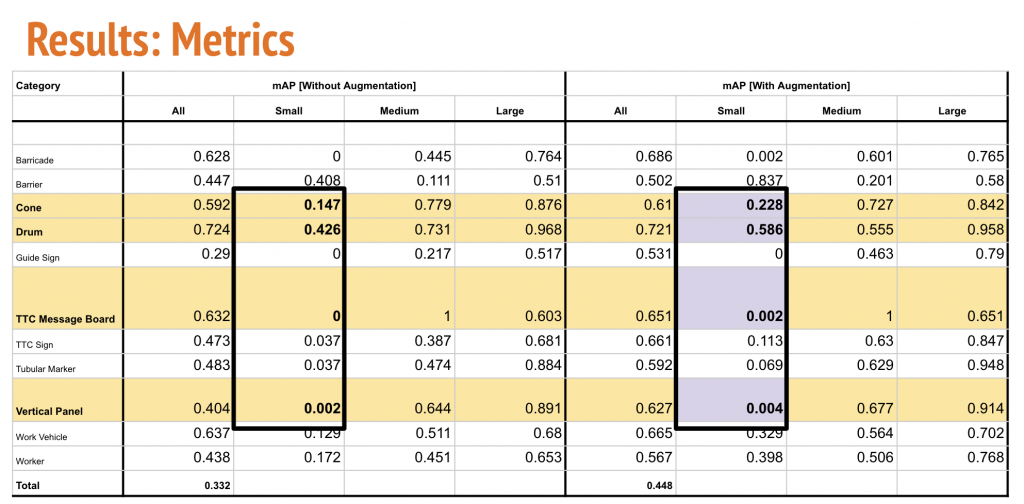
As expected, the performance of the model improved on a per-category basis as well as in overlap mAP. The mAP jumped to 0.448.

As expected, the performance of cones, drums, TTC message boards and vertical panel also improved for the smaller categories.
Per-Category Metrics
Probabilistic Heuristic Analysis
After the model predicts per category confidence scores for given 33 construction zone relevant categories, a probabilistic heuristic based analysis is performed to categorize a video frame as a construction zone.
The following factors are taken into account:
- Instance Type
- Instance Count
- Confidence of the Model in the prediction
Particularly, per-category weights are determined based on the mAP scores of the trained model. This essentially gives a good idea of how well a model performs on which category and what should be a good confidence to associate in a category for a model’s prediction. The instance count is accommodated to ensure lesser false positives. The confidence in the model is the softmax probability score that the model associates with its prediction.
A simple weighted average is performed for categorization of a work-zone. While giving a relative boost to those combinations of detections that are more likely to be present in a work-zone based on our prior knowledge and empirical analysis.

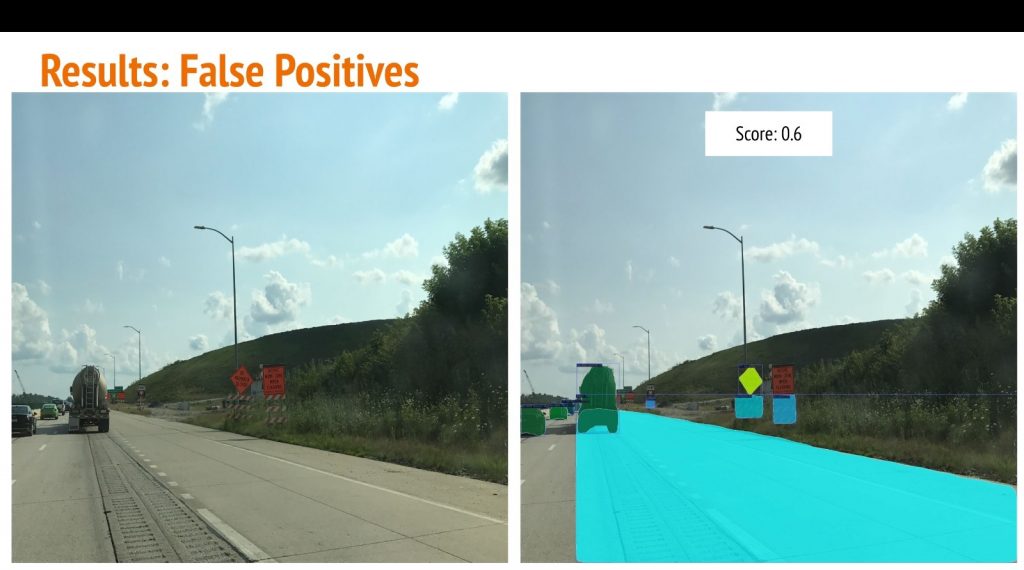
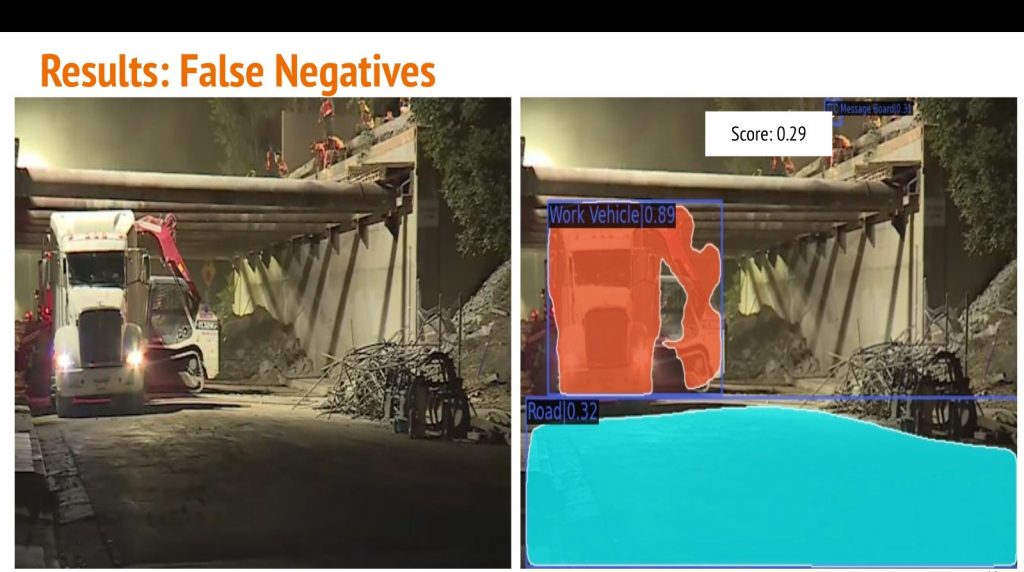
With this, we are able to retrieve images with work-zone pretty accurately. However, we have no access to “Ground-truth” labels of whether or not a given scene is considered a construction site or not. Here are a few results. We see that just giving a high weight to images with work-vehicle + signs etc. sometimes retrieves false positives as shown below. However, we do see that generally a good fraction of images that we perceive as true positives with diverse scenes, are retrieved using the current implementation.