Double Sphere Camera Model
Due to the extreme distortion that a fisheye lens produces, the pinhole camera model doesn’t apply. There are several models such as the Fisheye Projection Model[1] and the Kannala-Brandt Camera Model[2] which could be used. However, the inverse projection (3D point to 2D) either requires solving an optimization problem or expensive trigonometric operations. Enter Double Sphere Camera Model[3].
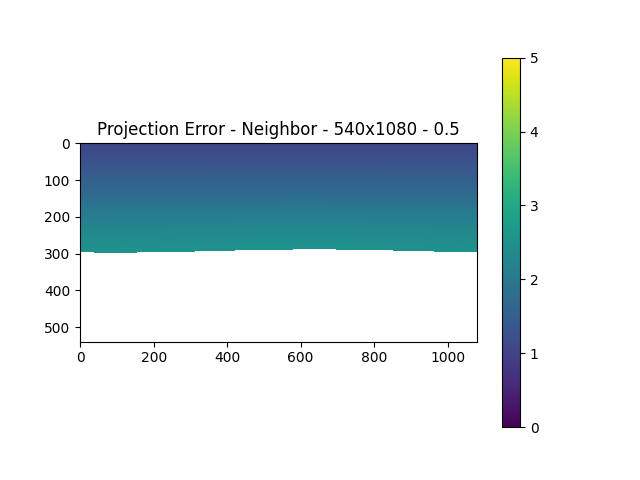
In order to verify that this model worked and to test that the project and inverse projection matched, we performed a small test. By taking a mask similar to a fisheye image, we projected each pixel to 3D space and then reprojected these back to the image plane. Both these operations were performed using the formulae defined by the Double Sphere Camera Model. The resulting pixel locations were compared with the original pixel locations and the projection errors were plotted.
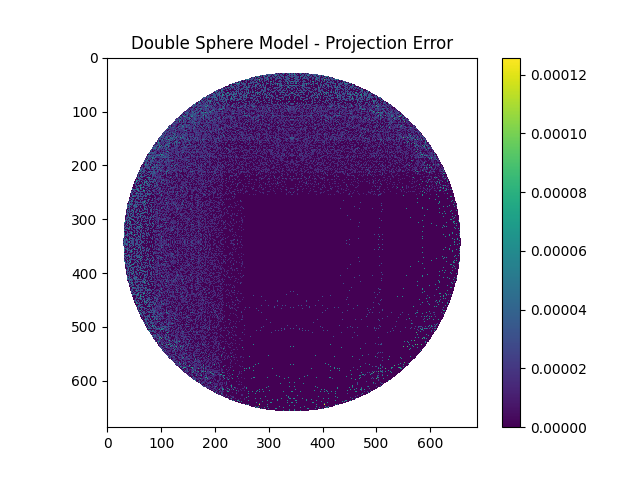
As can be observed, the maximum error was below a pixel separation of 0.0001 which was definitely acceptable. Thus, this camera model would work well for our project.
Determining Output Size
As part of our pipeline, the six fisheye images are stitched together into a panorama image.
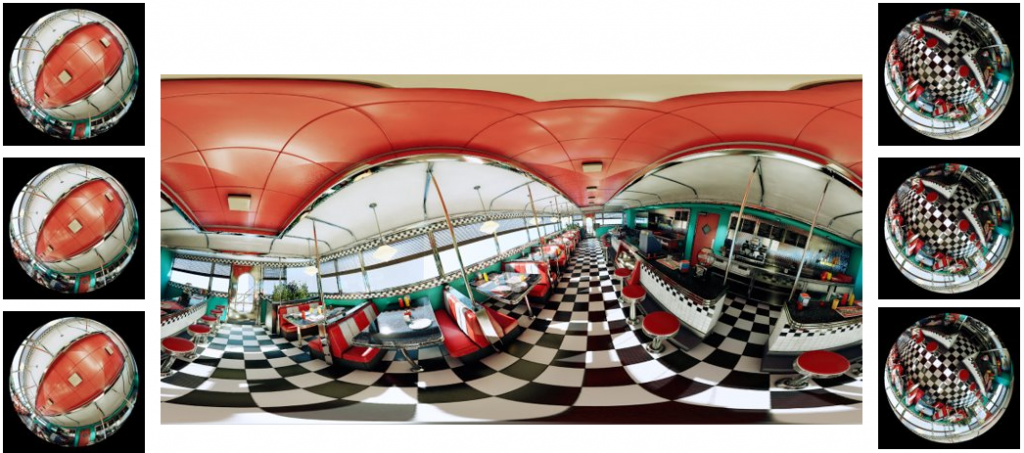
The input fisheye size is fixed due to the compute constraints and the requirements of the other modules. However, the output panorama resolution needs to be determined.
- It can’t be too low or else we wouldn’t be able to leverage the information captured by the input images.
- It can’t be too high or else there is a possibility that an input image pixel might correspond to more than 1 output pixel. This could lead to incorrect/blurry depth estimation.
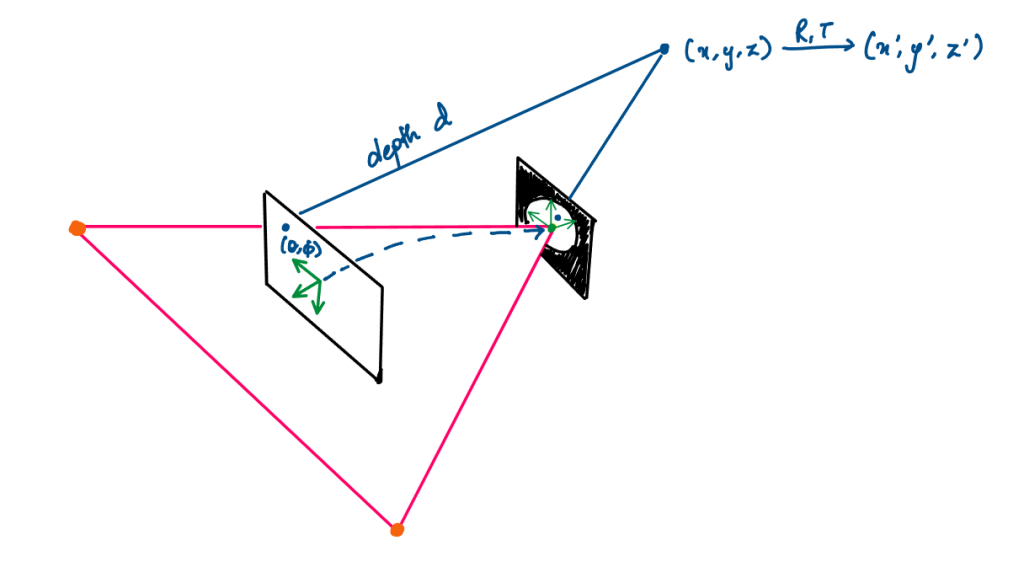
To calculate this correspondence
- An output pixel (denoted by
(theta, phi)) is projected to the 3D space in the Panorama frame –(x, y, z). - It is then moved to the 3D space in a particular Camera’s frame –
(x', y', z'). - Using the Double Sphere model, it is inversely projected onto the fisheye image plane.
- This is done for each output pixel and the difference with its neighbors is calculated.
Using the above methodology, we conducted our analysis.
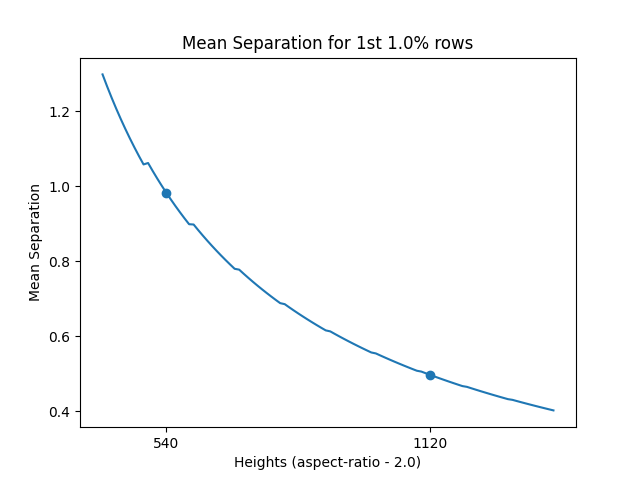
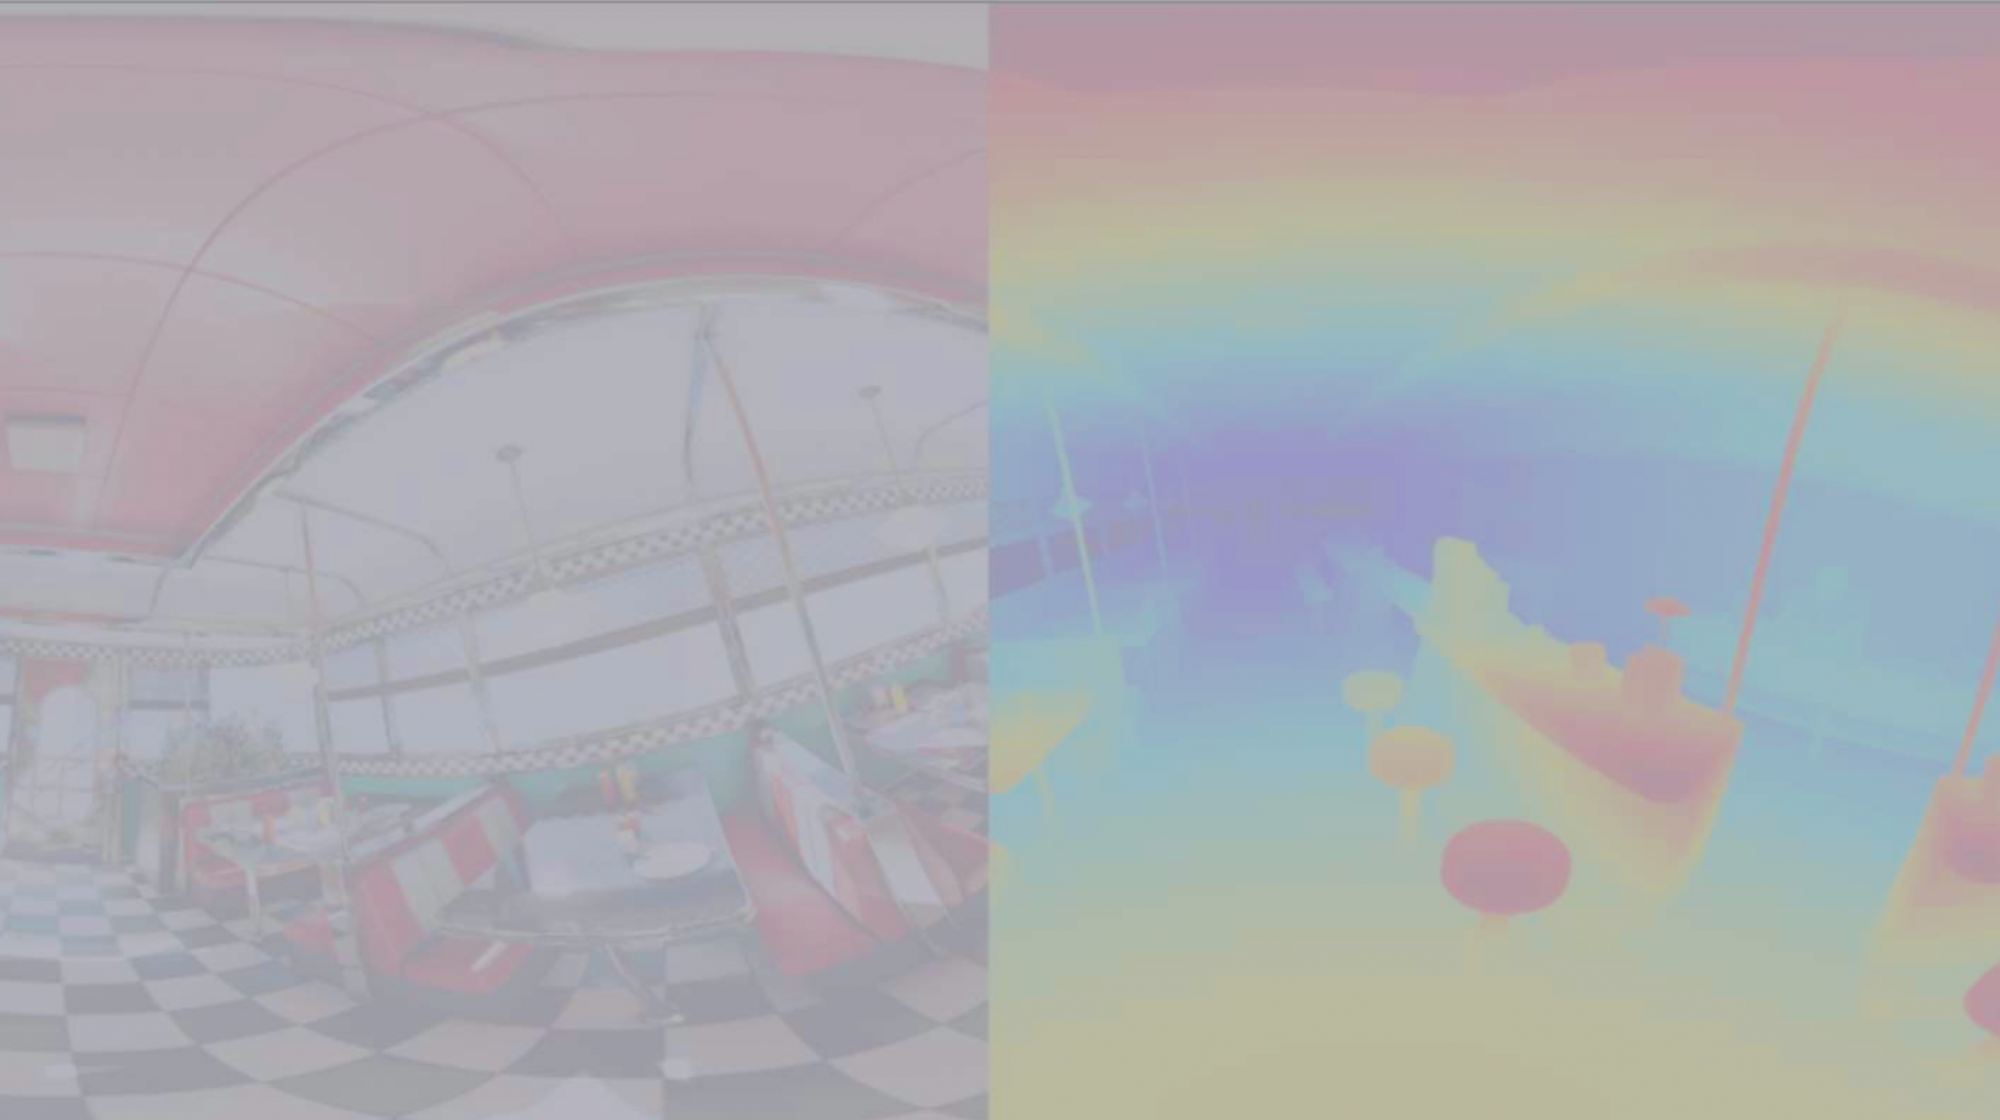
For an input size of 1224x1028, we found that at a height of 540px (and a width of 1080px – maintaining an aspect ratio of 2), the mean separation error for the 1st 1% rows just goes below 1px. Therefore, for any heights less than or equal to 540px, the minimum pixel separation would be above 1. This can be seen in the actual projection error heatmap as well.
The reason why we consider the top rows is because that’s the area, in a panorama image, that constitutes maximum distortion. Unlike the part of panorama images that represent forward, left, or right, the top view is covered by the entire width and so, the limited input pixels corresponding to the top view need to make up for the entire top rows. This would lead to maximum duplication of information.