Our proposed pipeline mainly consists of two modules, geometric manipulation module and semantic manipulation module. The geometric manipulation module warps the feature maps of input image guided by estimated 3D geometry. In this way, artifacts are reduced by moving the manipulation from image space to feature space. The 3D geometry introduced here helps handle extreme head pose and lightning condition. The warped feature maps are then fed to semantic manipulation module which synthesizes information that was not the input image.
Geometric Manipulation Module
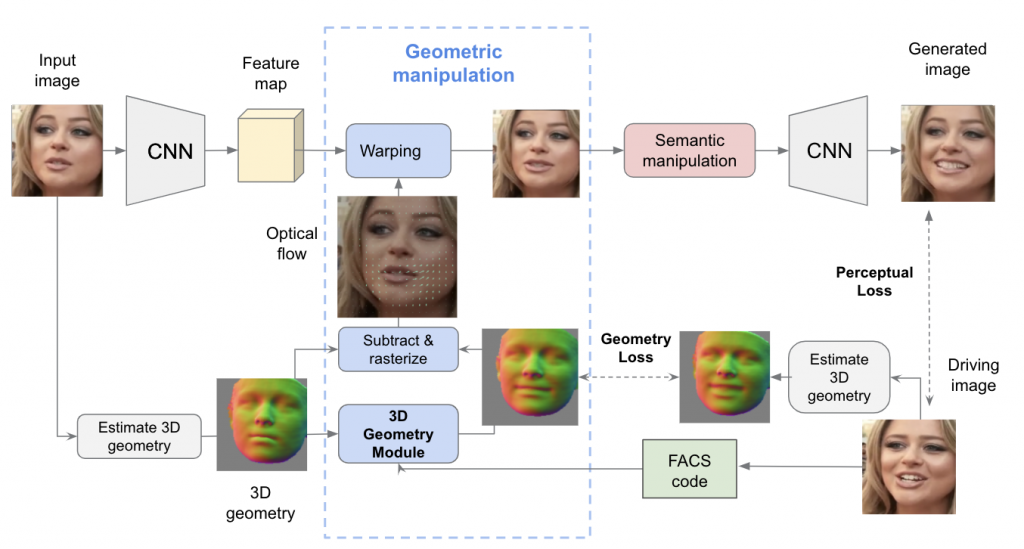
Figure 1. Geometric Manipulation Module.
As shown in Figure 1, given an input image and the FACS code of driving image as target expression, we first feed the input image into CNN encoder to extract its feature map. We also estimate the 3D geometry of the input image, which is later sent to the 3D geometry module to output an estimated 3D geometry of target image conditioned on target FACS code. Then we calculated an optical flow between input image and target image according to their estimated 3D geometry. Finally this optical flow is used to warp the feature map of input image.
Semantic Manipulation Module
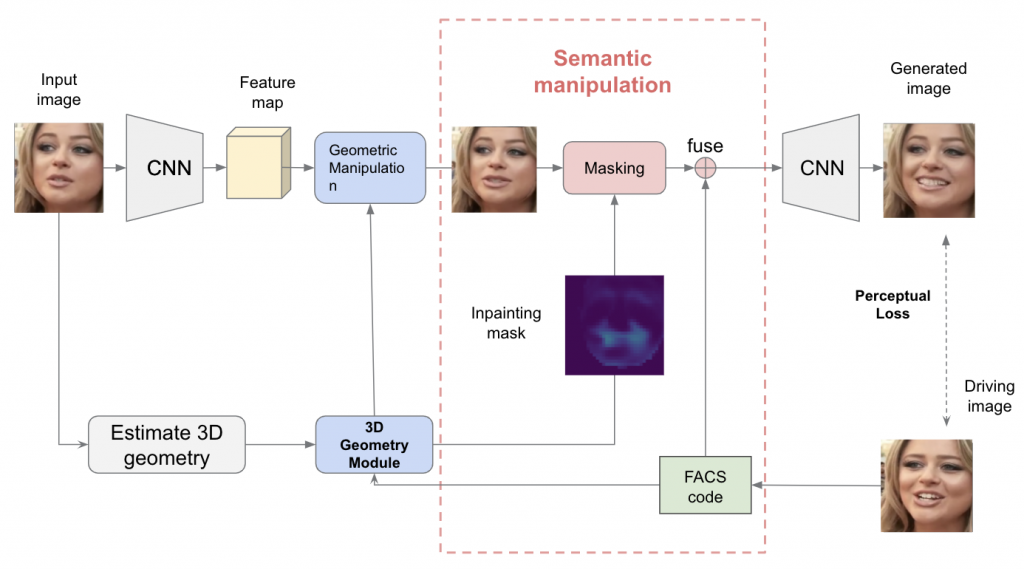
Figure 2. Semantic Manipulation Module.
Besides the estimated 3D geometry of target image, the 3D geometry module also outputs an inpainting mask which synthesizes information that was not the input image and locates areas that need to be inpainted (e.g. wrinkles and teeth). The Semantic Manipulation Module first masks the warped feature map with inpainting mask and then fuses this masked feature map with target FACS code. After fusing, the feature map is fed to an CNN decoder to get the generated image.
Supervision
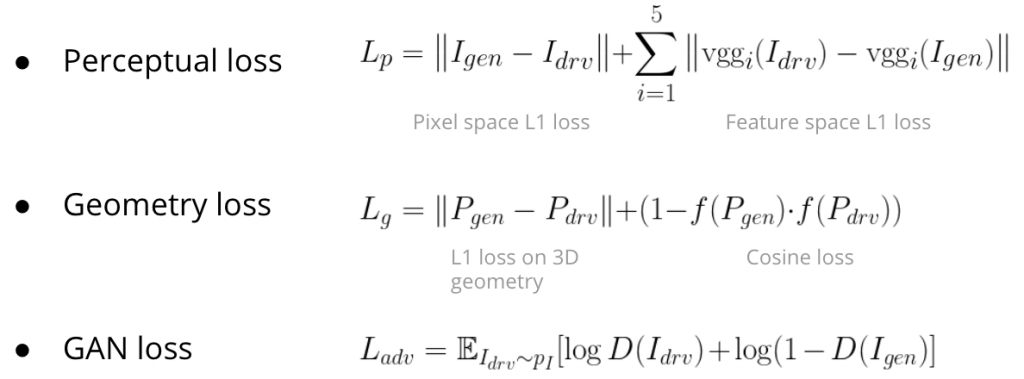
Our final loss function is the combination of perceptual loss, geometry loss and GAN loss as shown below. I denotes image, P denotes 3D geometry, D denoted discriminator.
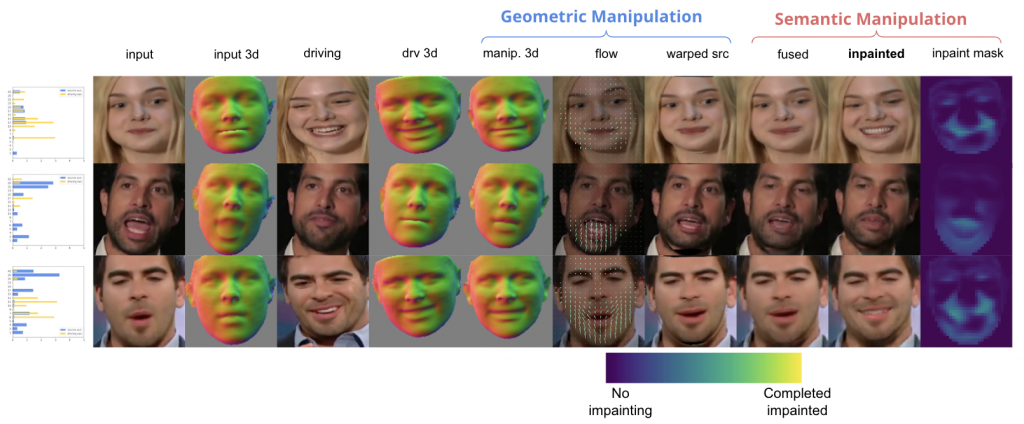
Qualitative illustration
Figure 3. An illustration of how each part of the pipeline works. The columns from left to right are bar chart of source FACS and target FACS, input image, input estimated 3D geometry, driving image, driving estimated 3D geometry, manipulated (estimated target)3D geometry, optical flow, image after warping, image after fusing, image after inpainting (final generated image), inpainting mask.
Individual AU Editing result
Figure 4. Individual AU editing examples. Each time we change the intensity of only one AU in the target expression while keeping the others the same.
Qualitative comparison with GANimation
Figure 5. Qualitative comparison examples with GANimation. Our model generate images with less artifacts and more robust to head pose changes.