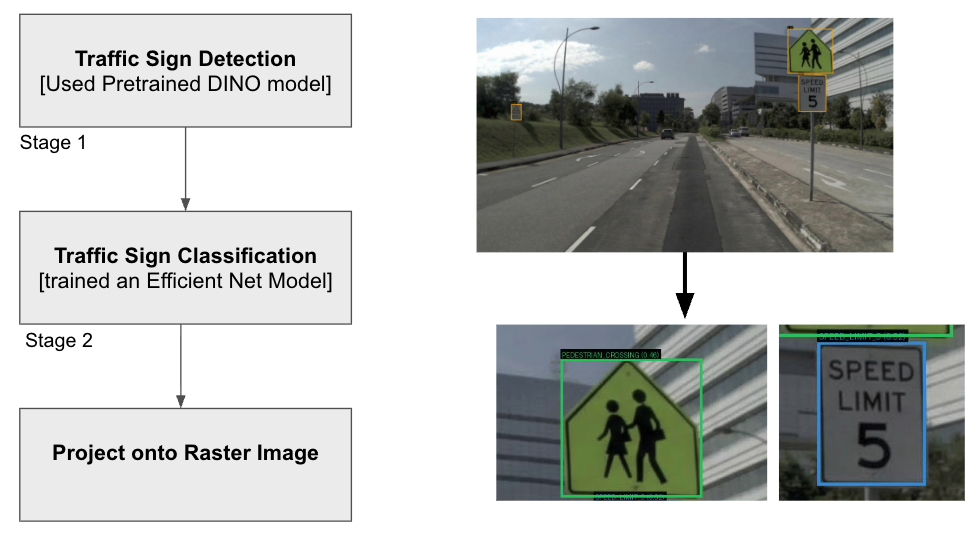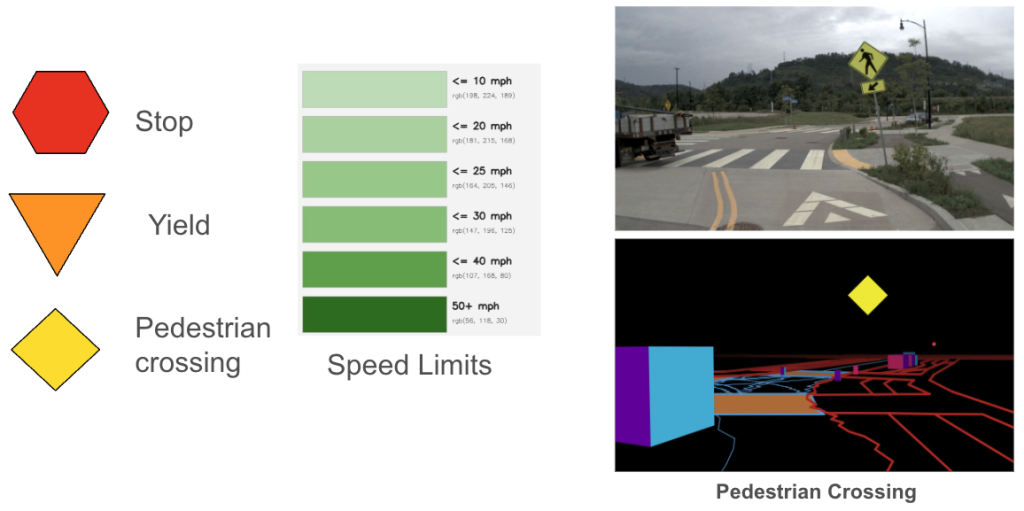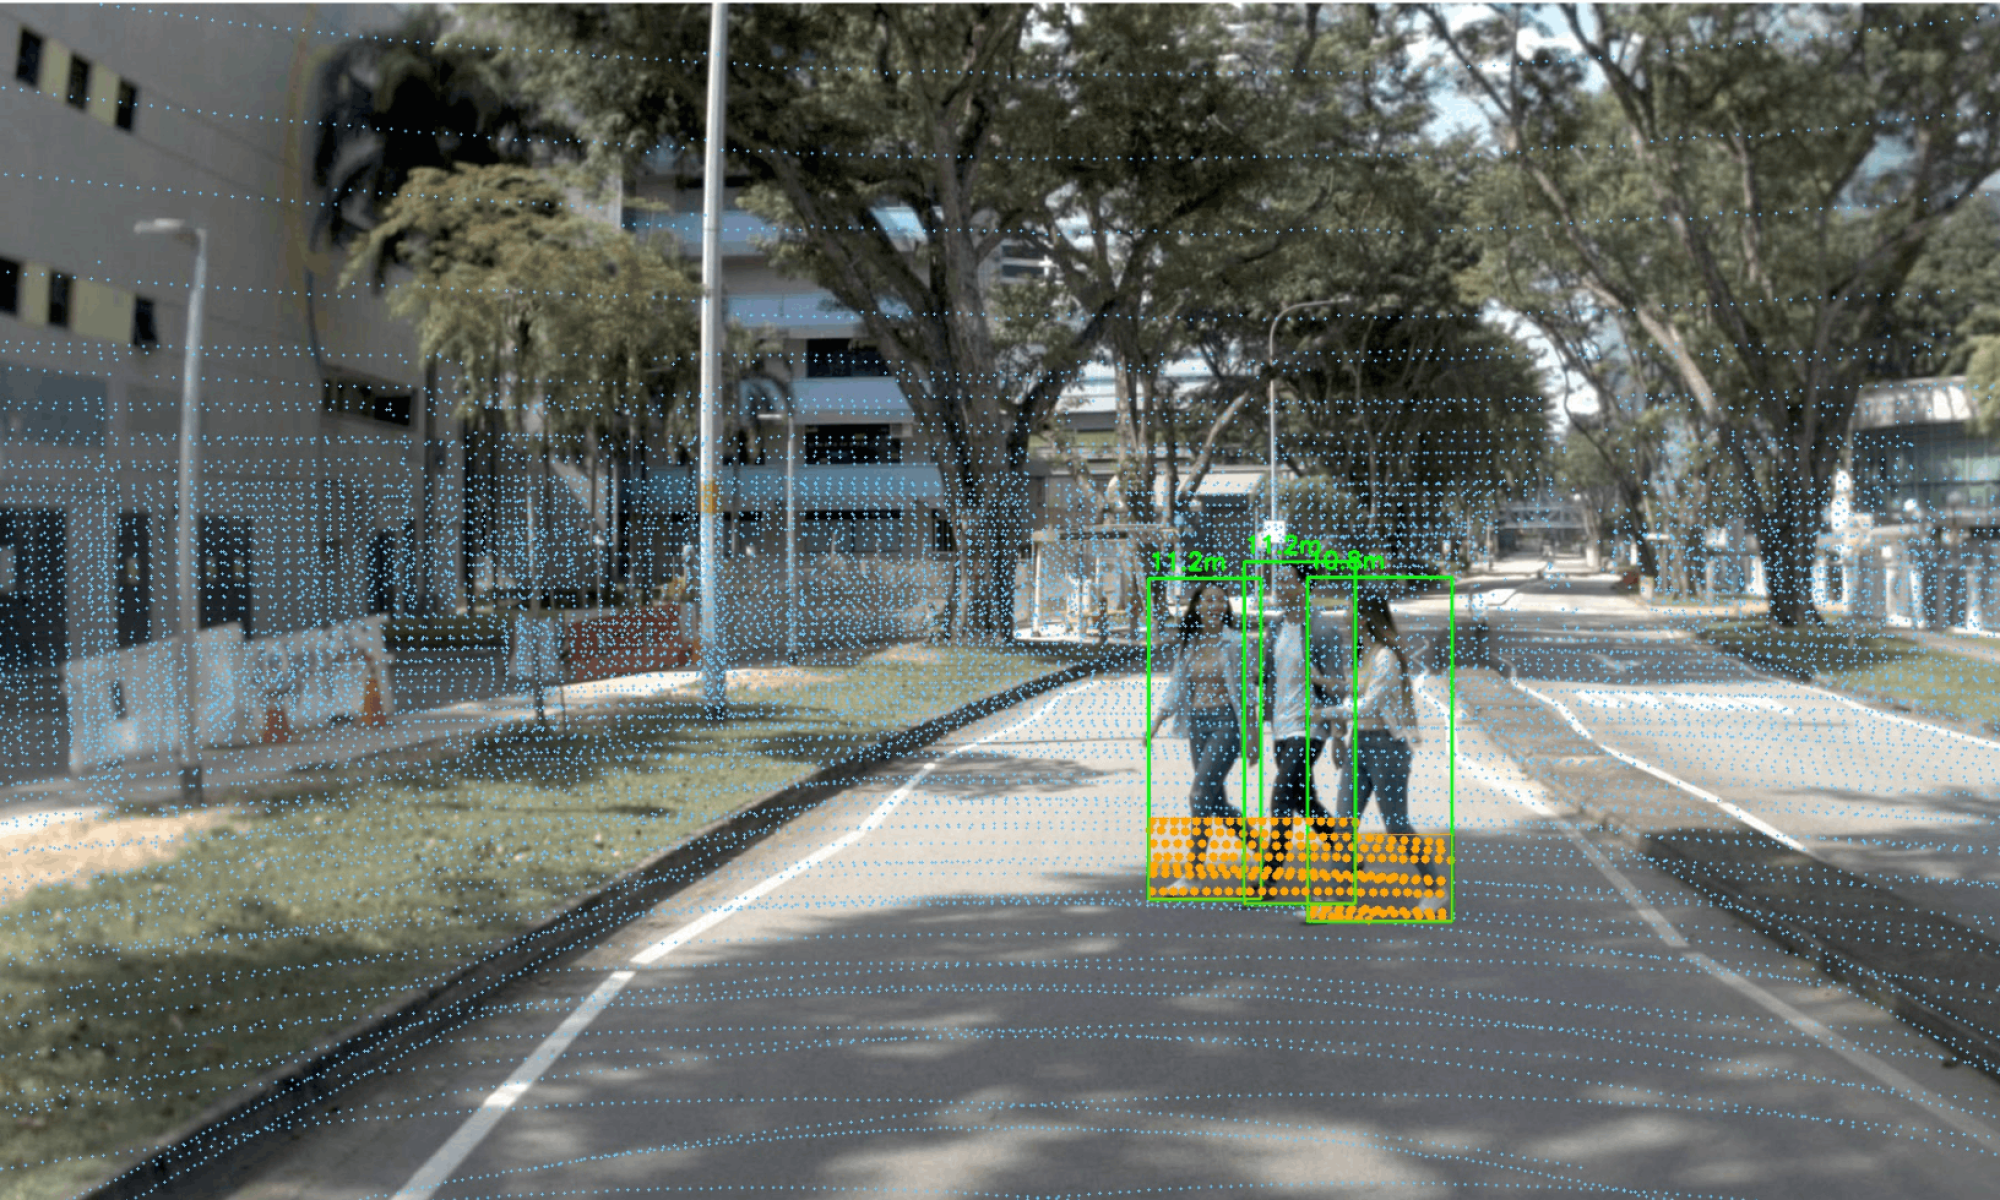
Simulation Based Data Augmentation
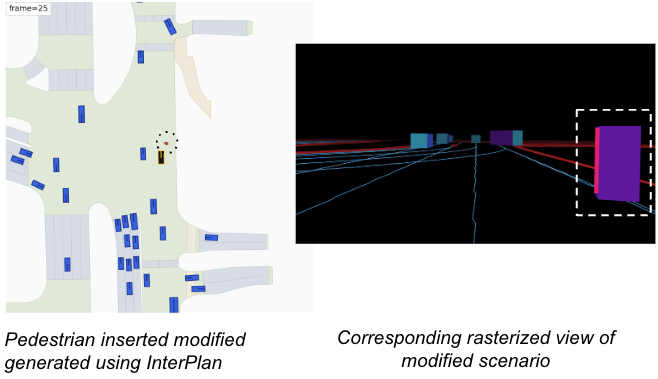
We generate long-tail scenarios by modifying original nuPlan logs using InterPlan, simulate them in nuPlan Devkit simulator, convert valid rollouts to rasterized representation and retrain RAP on the resulting dataset.
We focus on generating the following long-tail scenarios:
- Pedestrian focused scenario modification (primary)
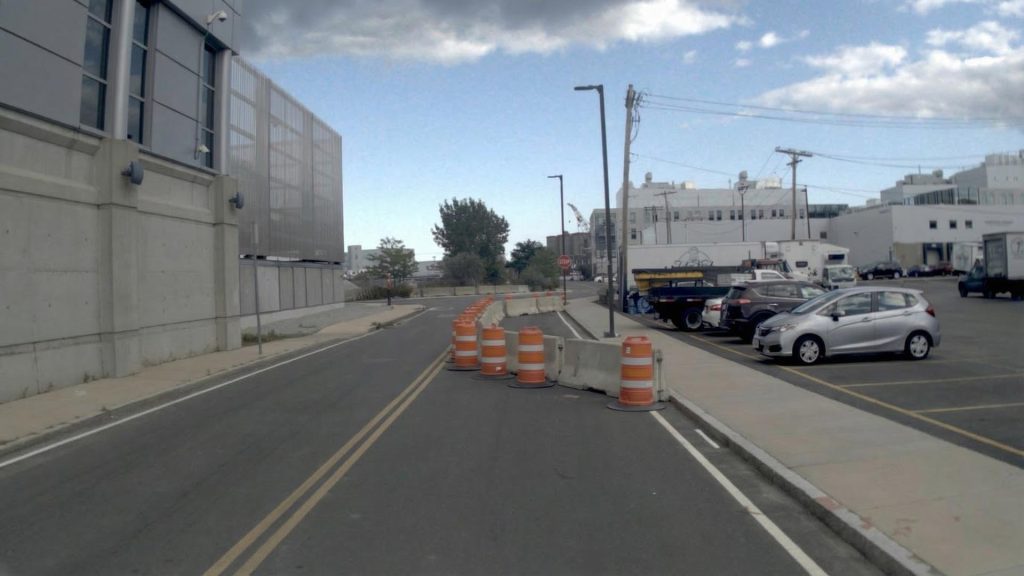
- Construction zone blockage
- Overtaking stopped/parked vehicle
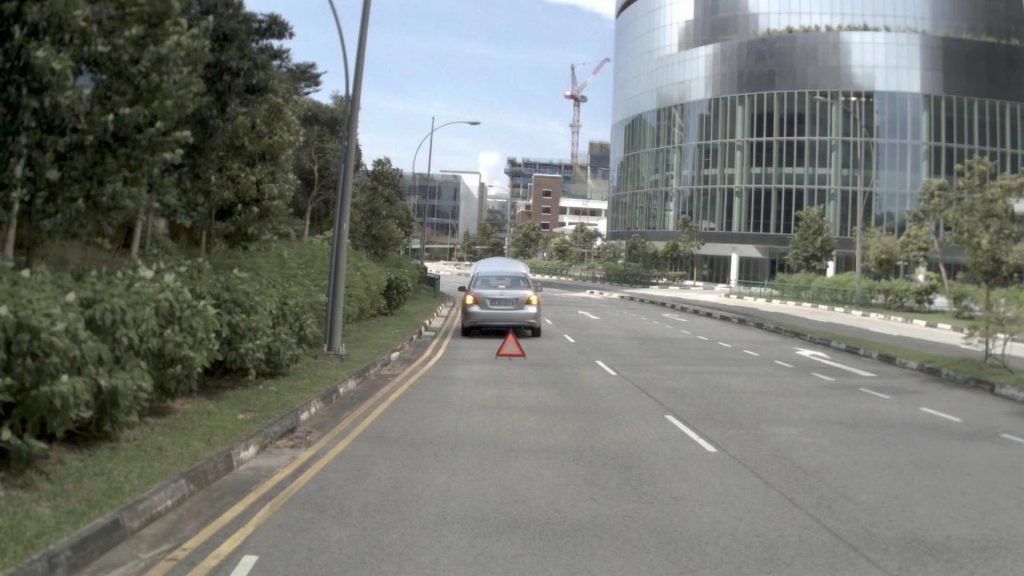
- Accident site navigation
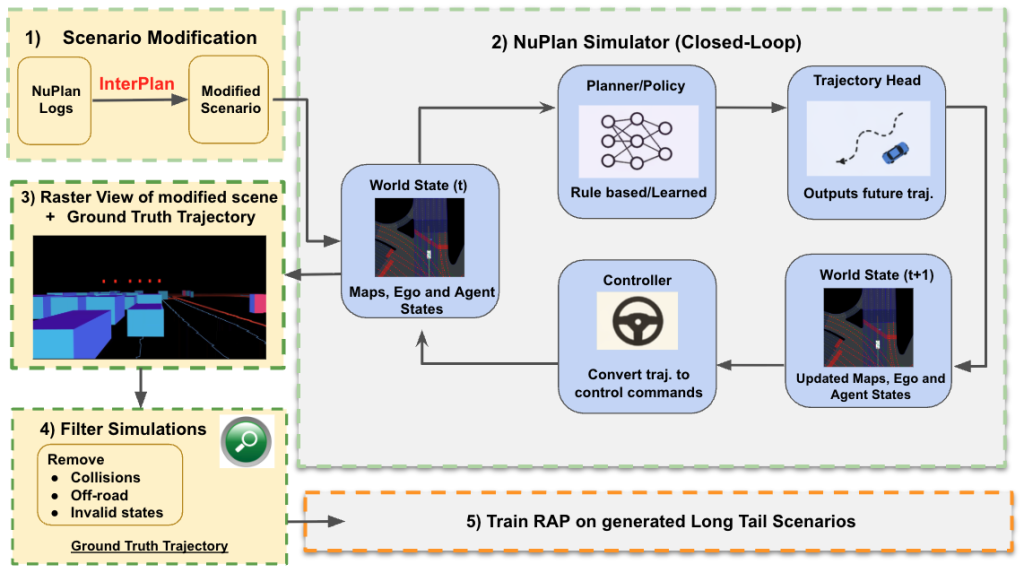
Rollouts from simulations are filtered to ensure only high quality ground truth trajectories are included in retraining data using the following criteria :
- Collision detection
- Invalid state filtering
- Smoothness metrics (jerk)
- Traffic lane compliance
We plan to use an ensemble of rule based and learned policies to predict and filter the best rollouts from each scenario. The initial results below are using rule based policy PDM-closed
Analysis Overview
We investigate RAP’s failure modes through off-policy analysis, probing its behaviour on edited scenes across three categories: pedestrians, traffic signs, and unguarded obstacles.
Pedestrian Analysis
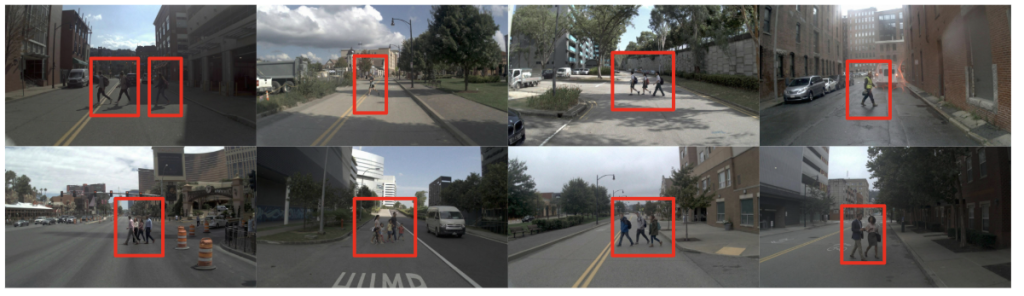
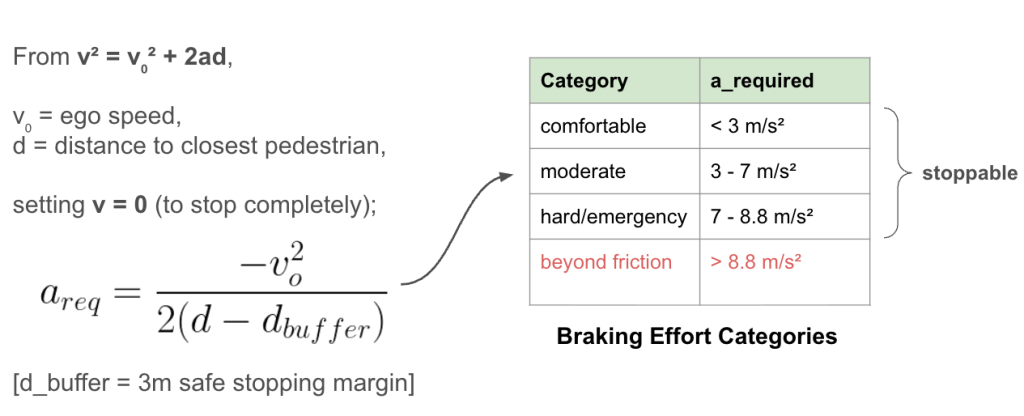
Synthetic jaywalking pedestrians were inserted into front camera RGB of 48 nuPlan scenes using the Gemini API, producing 144 edited scenes across three density conditions. Using LiDAR depth, we computed the required deceleration to stop safely for each scene and bucketed responses into comfortable, moderate, hard, and emergency braking categories.
Obstacle Analysis
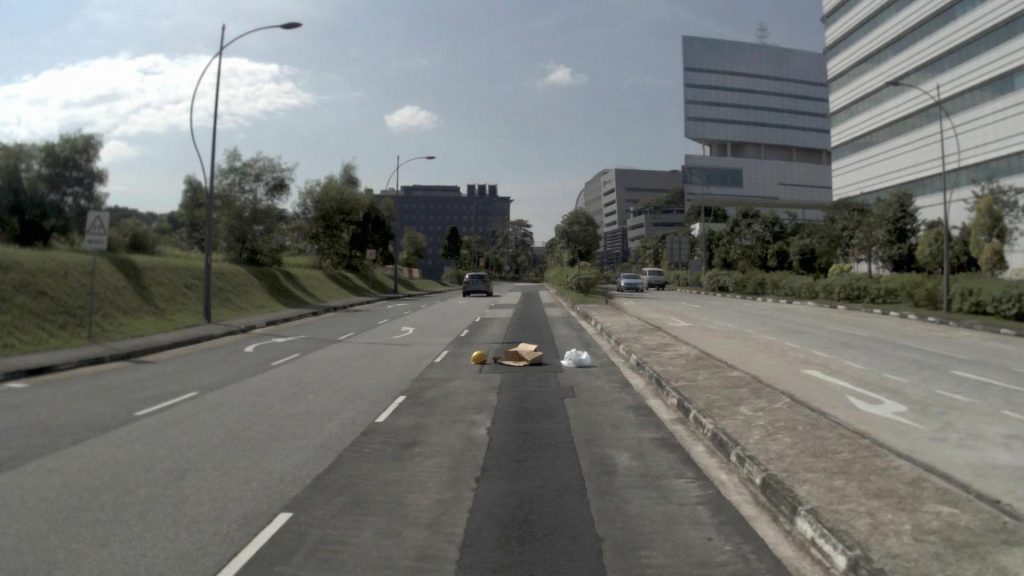
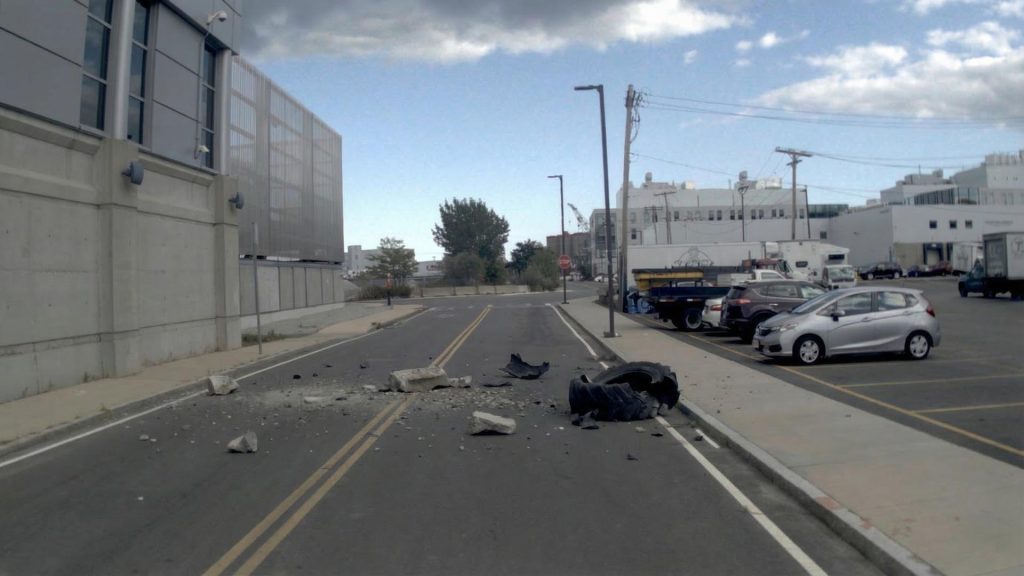
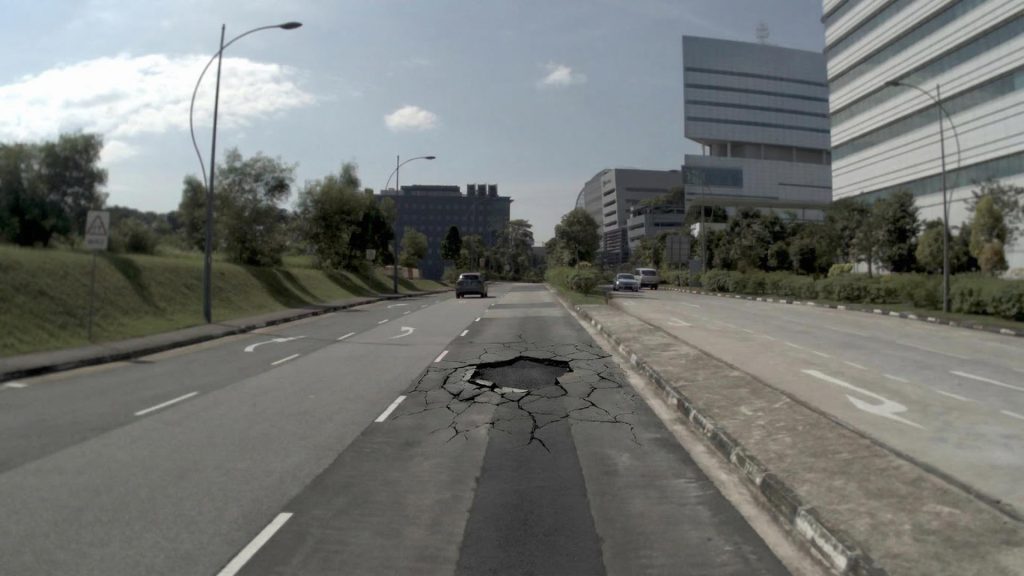
We generated synthetic visual interventions by inserting physical obstacles into nuPlan RGB scenes across categories including broken down cars, road blockages, debris on road, and lane closures. RAP inference was run on both the original and edited RGB, and trajectory deviation was measured using ADE/v to assess whether the model reacts to each obstacle type.
Traffic Sign Analysis
Following the same visual intervention approach, we inserted traffic signs including stop signs, speed limit signs, and school zone markers into nuPlan RGB scenes and measured RAP’s trajectory deviation using ADE/v.