Pedestrian Analysis
Setup
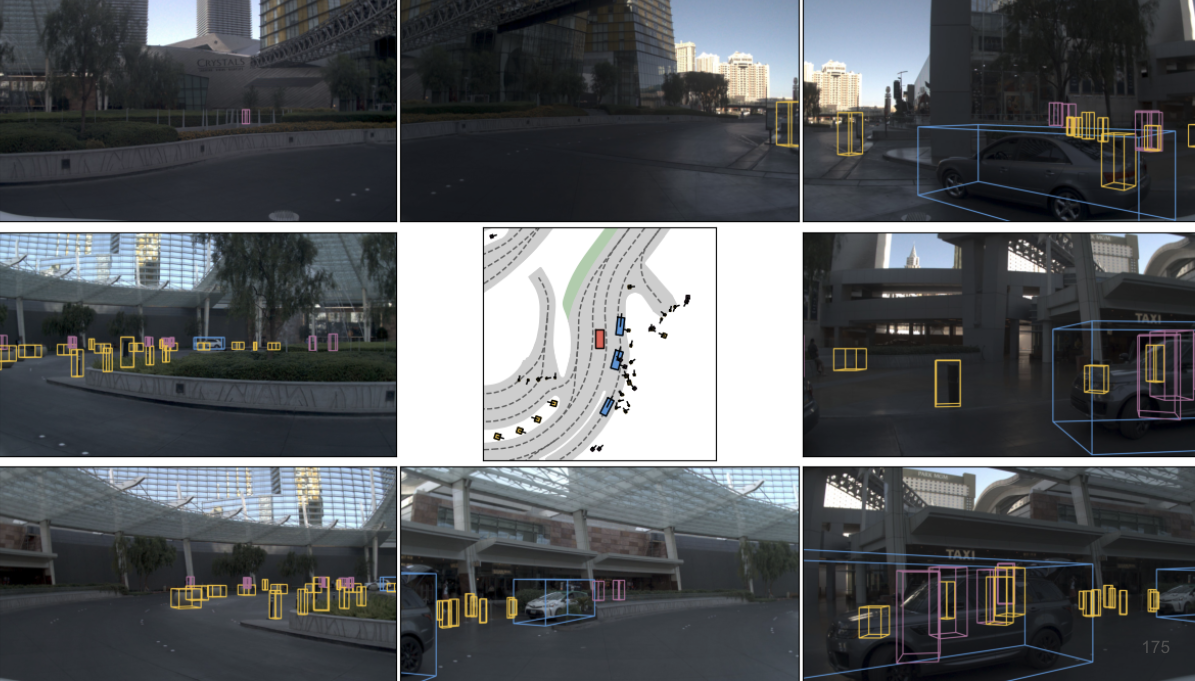
We evaluated RAP on 144 edited scenes per speed condition, where synthetic jaywalking pedestrians were inserted into front camera RGB. All analysis is conducted off-policy: RAP’s predicted trajectory is compared against the edited scene without closed-loop replanning. A scene is counted as a correct response if the model predicts a trajectory that stops before the pedestrian.
RAP Stopping Behavior
RAP stopped in fewer than half of all scenes at best. At 3.0 m/s under original log acceleration, the model correctly stopped in only 48.61% of scenes despite all scenes being physically stoppable. Performance deteriorates sharply at higher speeds: at 7.5 m/s, only 7.64% of scenes resulted in a correct stop. At highway speeds (13.1 m/s), the model almost never stopped regardless of input acceleration.
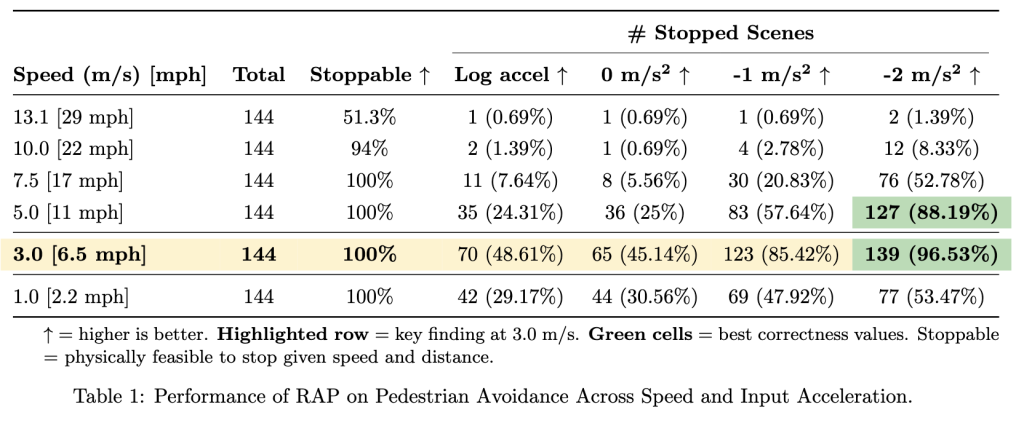
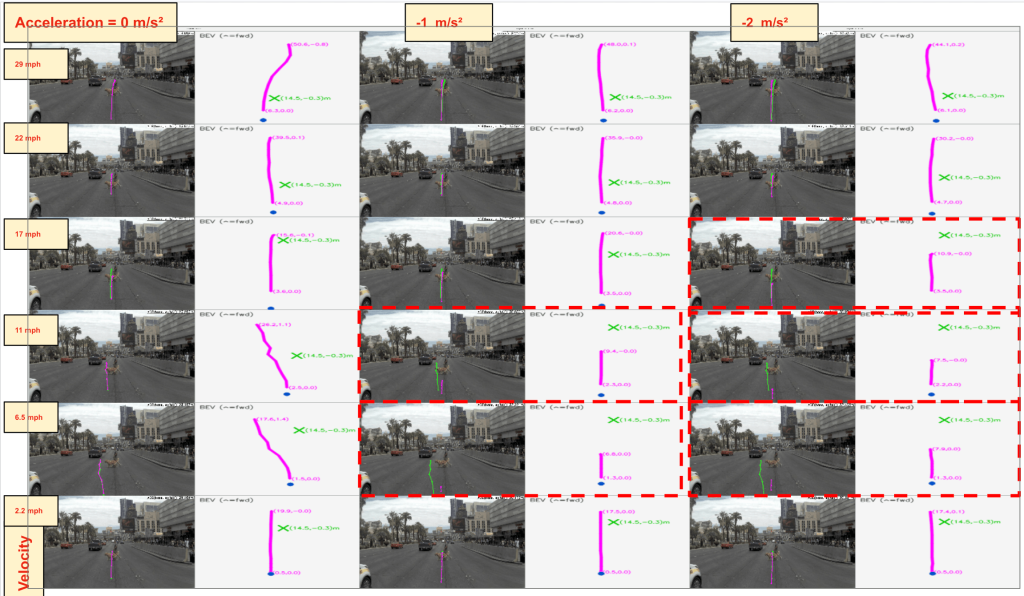
A critical insight emerges when varying the input acceleration. Explicitly providing a harder braking signal of -2 m/s² raises the stopping rate from 48.61% to 96.53% at 3.0 m/s. This demonstrates that the model is physically capable of stopping but does not generate sufficient braking from visual input alone. The failure is not perceptual: it is a supervision gap rooted in the training data.
Effect of Pedestrian Density
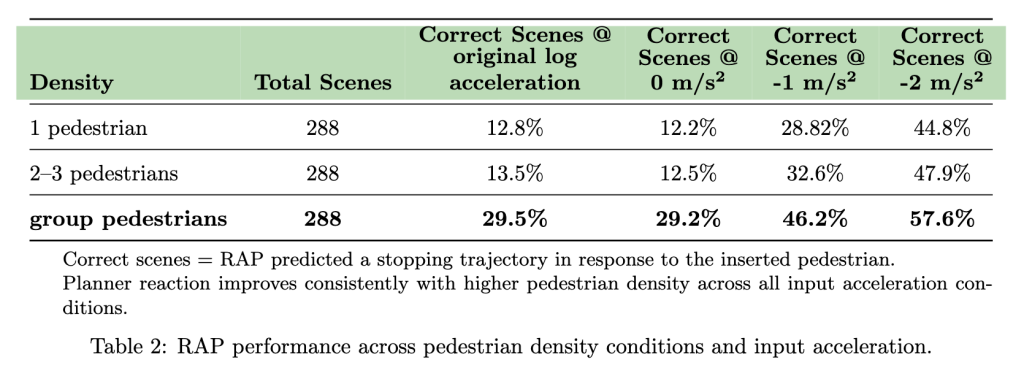
We further evaluated whether pedestrian density affects RAP’s response across three conditions: single pedestrian, groups of 2 to 3, and larger groups. Reaction rate improves consistently with density. Group pedestrian scenes achieved 29.5% correct responses under original acceleration, compared to 12.8% for single pedestrian scenes. This suggests RAP’s response is partially driven by visual salience rather than semantic reasoning about individual pedestrians.
Why Does RAP Fail to Brake?
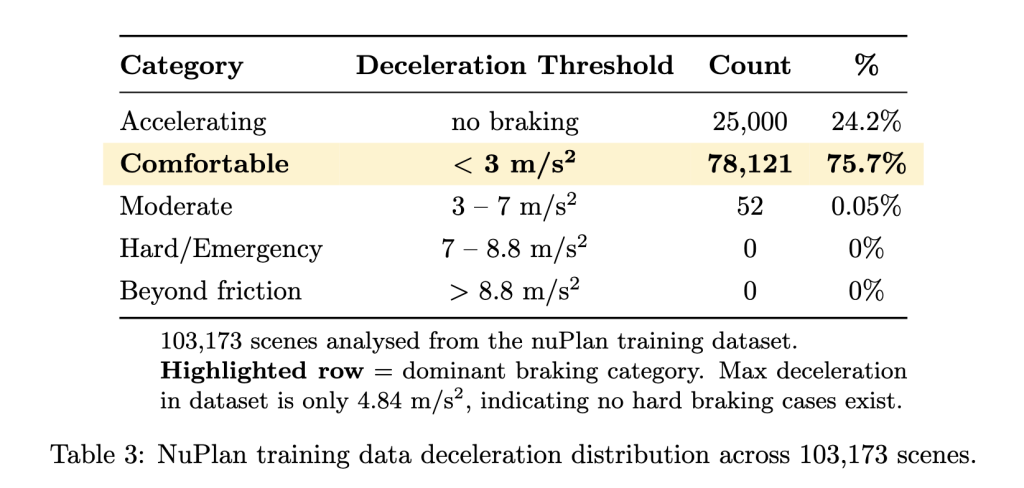
Analysis of 103,173 nuPlan training scenes reveals the root cause. 75.7% of all scenes involve only comfortable braking under 3 m/s², and the maximum deceleration recorded in the entire dataset is 4.84 m/s². There are zero hard braking and zero emergency braking cases. The model has simply never seen a hard stop during training and cannot generate one from visual input alone.
Obstacle Analysis
Setup
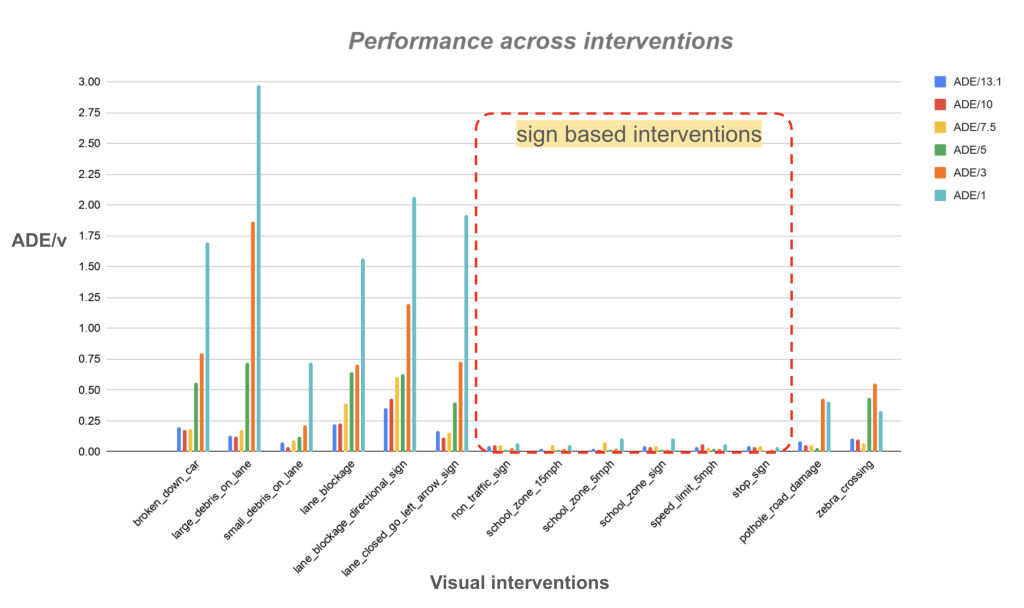
We tested RAP on visual interventions covering four physical obstacle categories: broken down cars, road blockages, debris on road, and lane closures. Trajectory deviation was measured using ADE/v, the average displacement error normalized by ego velocity, comparing predictions on original versus edited RGB scenes.
Key Findings
Three consistent patterns emerge across all obstacle types.
1. RAP responds better to larger obstacles. Large debris produces significantly higher ADE/v than small debris, suggesting the model’s response is driven by the visual footprint of the object rather than its semantic identity.
2. Reaction degrades sharply at higher velocities, with the model failing to respond to road blockages above 7.5 m/s.
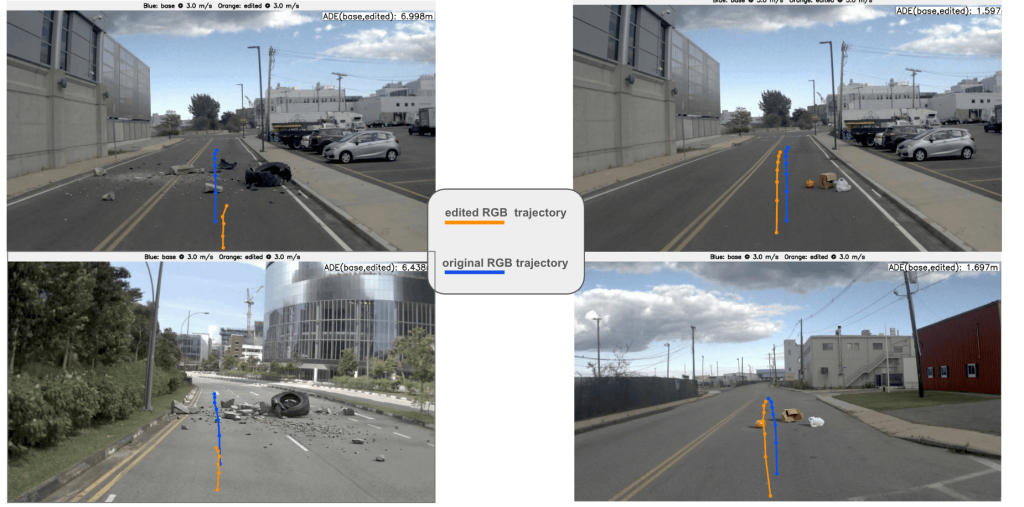
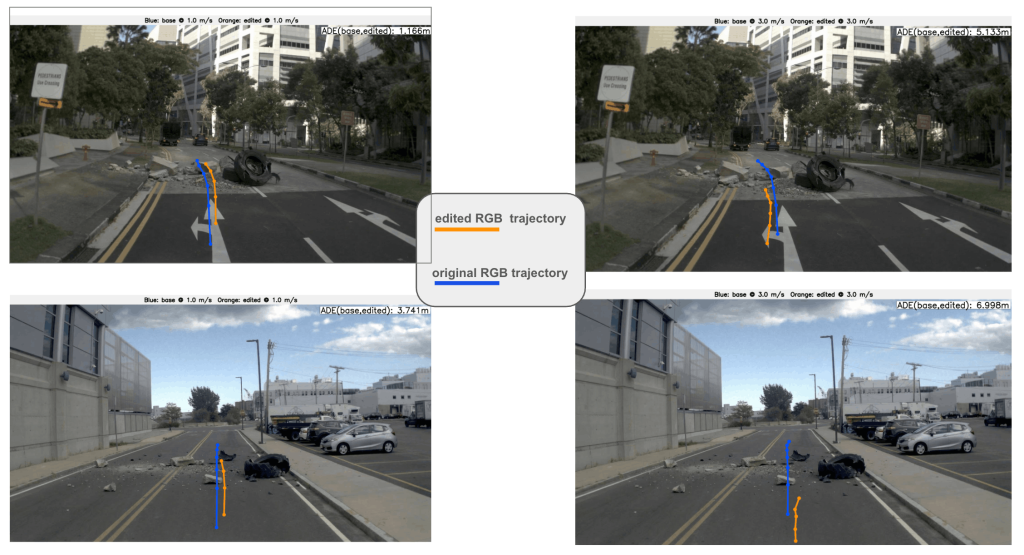
3. The model occasionally steers around obstacles at low speeds but does not generate a complete stop, indicating partial but insufficient avoidance behavior.
Traffic Sign Analysis
No Reaction to Signs
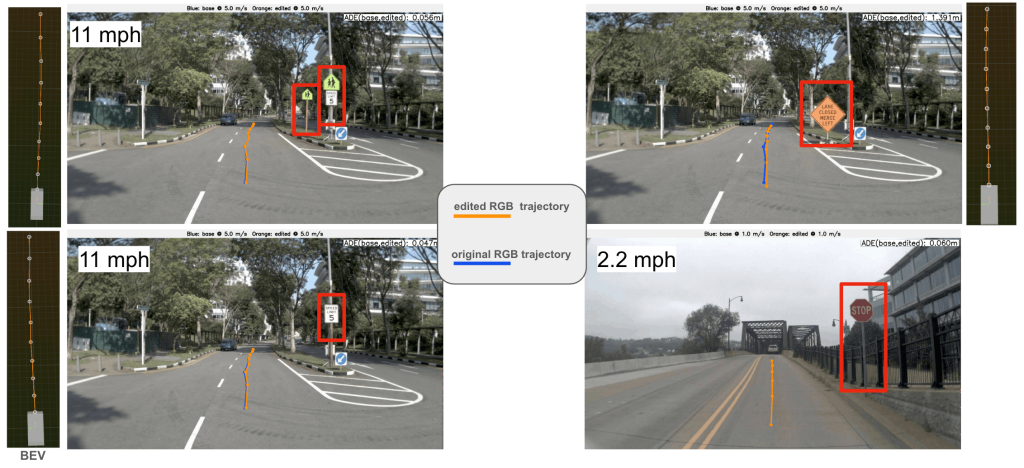
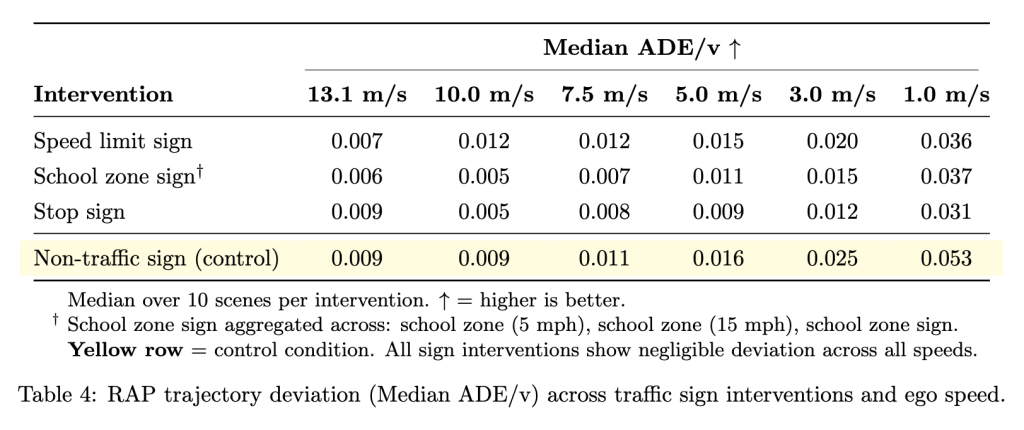
Inserting speed limit signs, school zone signs, and stop signs into RGB scenes produced near-zero trajectory deviation across all conditions. ADE/v values for all three sign types are statistically indistinguishable from the non-traffic sign control condition at every tested ego speed. RAP plans as if traffic signs do not exist in the scene.
Encoder Analysis
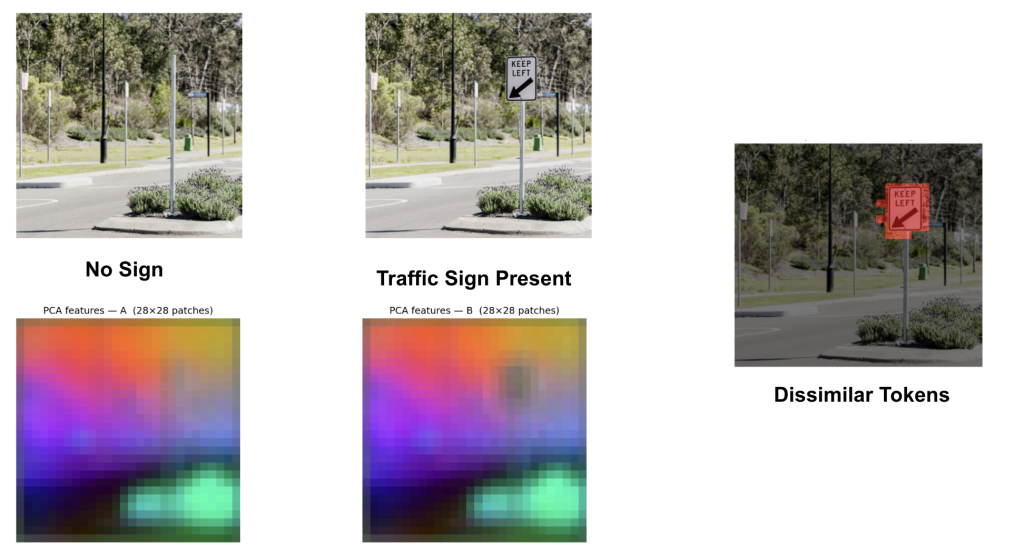
The absence of response raises a fundamental question: is the encoder failing to perceive the signs, or is the planner failing to act on them? To answer this, we analyzed the encoder’s projection layer using PCA. Comparing feature maps with and without a traffic sign present, the embeddings are visibly different, confirming the encoder does capture sign-related information. The failure lies entirely in the downstream planner, which does not route these features into trajectory prediction. Signs are seen but not acted upon.
Summary of Findings
Our off-policy analysis across three tracks reveals a consistent picture. RAP’s failures trace back to two structural causes.
First, the rasterized representation omits traffic sign information entirely, and while the encoder perceives signs in RGB, the planner is never trained to use them.
Second, the nuPlan training distribution is heavily skewed toward comfortable, low-stakes driving scenarios, leaving the model without the supervision signal needed to respond to pedestrians, obstacles, or emergency situations at higher speeds.
These findings directly motivate simulation-based data augmentation as the path forward.