Simulation on CARLA simulator
Dataset
We use the famous CARLA[1] dataset for both training and evalution. CARLA has been developed from the ground up to support development, training, and validation of autonomous driving systems. In addition to open-source code and protocols, CARLA provides open digital assets (urban layouts, buildings, vehicles) that were created for this purpose and can be used freely. The simulation platform supports flexible specification of sensor suites, environmental conditions, full control of all static and dynamic actors, maps generation and much more.
Experimental Setup
We follow the experimental setup of Transfuser, trained the Transfuser and our proposed Transfuser w/ ff on the same training dataset, which is generated using CARLA simulator, provided by the authors of Transfuser. We evaluate both methods using the same configuration on the CARLA simulator.
Methods
Transfuser: The original Transfuser baseline.
Transfuser w/ ff : Our proposed Transfuser with auxiliary freespace forecasting task.
Visualization results
(1): Turning left when there is a motor rider. Transfuser got blocked; Transfuser w/ ff avoided being blocked.
Transfuser link: https://youtu.be/URAvD2X9FHI
Transfuser w/ ff link: https://youtu.be/0_mTwB4eKH8
(2): Normally going in front. Transfuser just stopped without reasons; Transfuser w/ ff went through as common.
Transfuser link: https://youtu.be/L9QWdc9jG-U
Transfuser w/ ff link: https://youtu.be/Z5W5i3PIxYI
(3): Facing dangerous behaviors of others. Transfuser crashed with another car and ran over the person; Transfuser w/ ff successfully detected the behaviors and stopped before crashing.
Transfuser link: https://youtu.be/rCyCmf-3Mpg
Transfuser w/ ff link: https://youtu.be/N5icm2Vdo5c
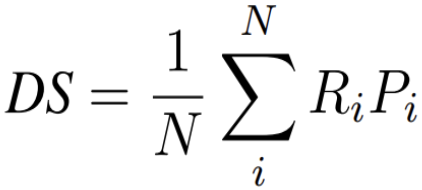
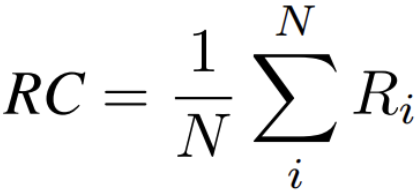
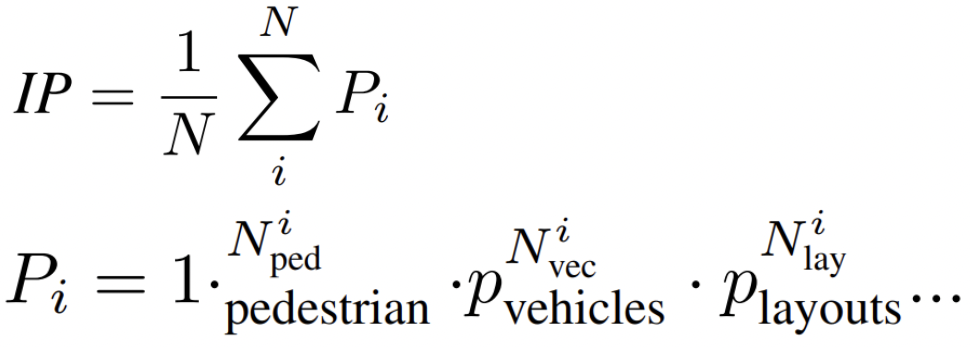
Experimental results
| Driving Score | Route Completion | Infraction Penalty | |
| Transfuser | 42.563 | 90.688 | 0.512 |
| Transfuser w/ ff | 45.781 | 87.773 | 0.554 |
Driving Score: The main metric, serving as an aggregate of the average route completion and the number of traffic infractions.
1
1
Route Completion: Percentage of route distance completed by an agent.
1
1
Infraction Penalty: Aggregates the number of infractions triggered by an agent as a geometric series.
| Average num of infractions | Pedestrians | Vehicles | Layouts | Red Lights |
| Transfuser | 0.125 | 0.438 | 0.063 | 1.594 |
| Transfuser w/ ff | 0 | 0.406 | 0 | 1.469 |
Conclusion
With additional freespace forecasting, our model improves the general driving score and provides safer local motion planning compared with the baseline model. In our further analysis, it as well decreases the collion rate with pedestrians, layouts and vehicles. But freespace forecasting does little assistance with red lights detections, as the freespace takes more from LiDAR data rather than RGB images, from which the traffic lights can be detected. We would need to explore more efficient way to use RGB information.
Cost Map Prediction
Visualization results
General results


Waypoints cost map results


Collision cost map results


Conclusion
For waypoint cost map prediction, the short distance accuracy is acceptable, but it is not trivial for the model to figure out the correct direction if there is a turning point in the future. For collision cost map prediction, the model can locate the main objects nearby such as vehicles correctly, but sometimes it ignores small targets like pedestrians or people who are blocked by other vehicles.
Still need to improve the prediction quality.
Reference
[1]. Dosovitskiy, Alexey, et al. “CARLA: An open urban driving simulator.” PMLR, 2017.